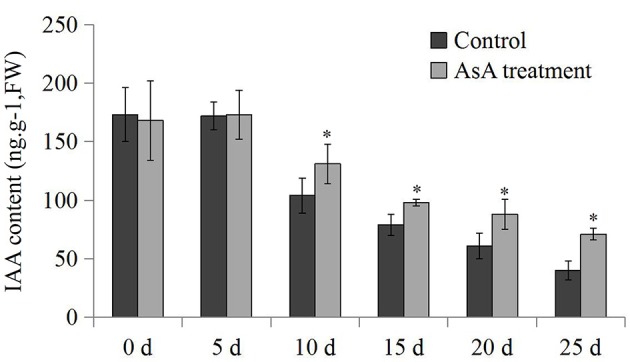
Figure 7.

The IAA content measurements. The differences in IAA contents between the controls and AsA-treated fruits during the postharvest process. The data were analyzed by five independent repeats, and standard deviations were shown with error bars. The significant (P < 0.05) differences between the controls and AsA treatments are indicated by an asterisk.
