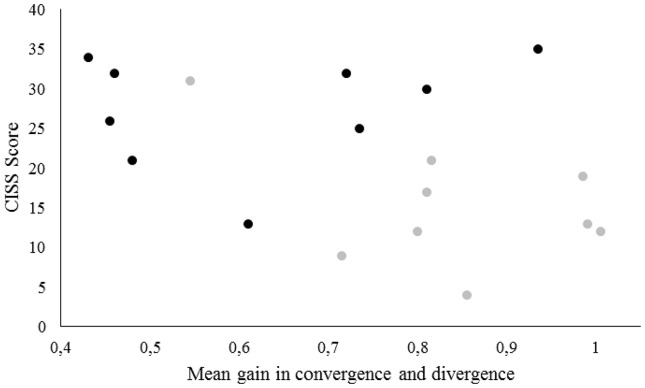
Figure 5.
Scatter plot of the mean gain values ((summation of the gain in convergence and divergence)/2) in the first vergence test of the first and the fifth session of rehabilitation as a function of the CISS score. Black plots represent the gain values in the first vergence test of the first session as a function of the CISS score prior to rehabilitation. Gray plots represent the gain values in the first vergence test of the fifth session as a function of the CISS score after the vergence rehabilitation.

