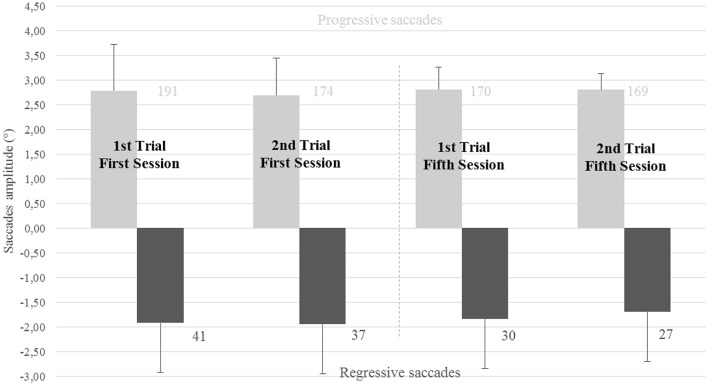
Figure 6.
Mean amplitude, SD and number of progressive and regressive saccades: in light-gray, the mean value and the standard deviation concerning the amplitude of the progressive reading saccades; in dark-gray, the mean value and the standard deviation concerning the amplitude of the regressive saccades. Numbers on each column indicate the number of saccade in each reading trial next to each bar.

