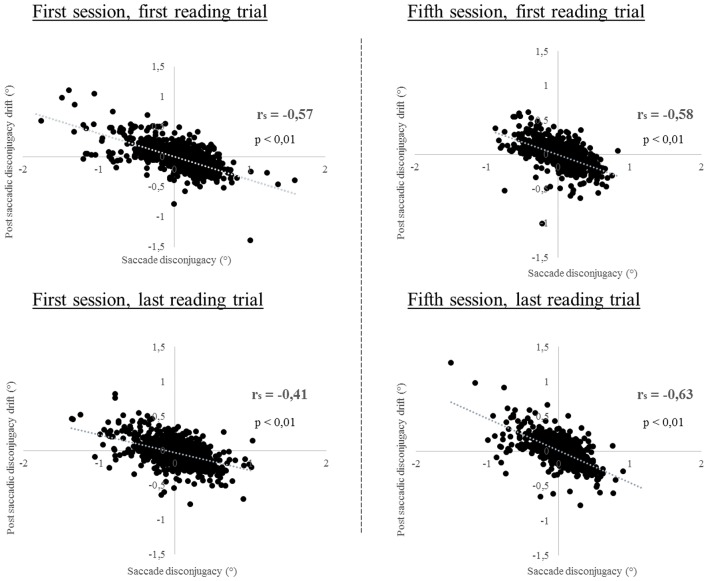
Figure 8.
Linear regression plot of the amplitude of saccade disconjugacy in degrees (°) as a function of the amplitude of the following post-saccadic disconjugacy drift in degrees (°) measured 80 ms after the end of each progressive reading saccade. The entire sample has been plotted for each reading trial. Spearman rs correlation coefficient and p-values are indicated.

