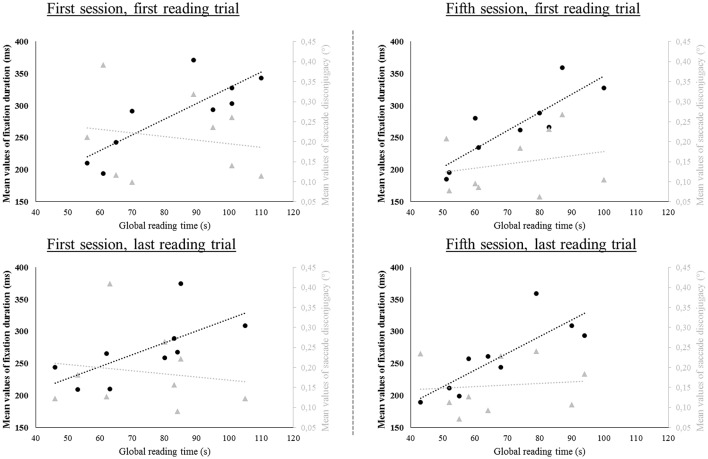
Figure 9.
Linear regression plot of the mean values of the amplitude of saccade disconjugacy in degrees (°, light gray marks) and of the mean values of the fixation duration in milliseconds (ms, black marks) as a function of the global time of reading in seconds (s). The individual mean values have been plotted for each reading trial and trend lines have been added for each variable.

