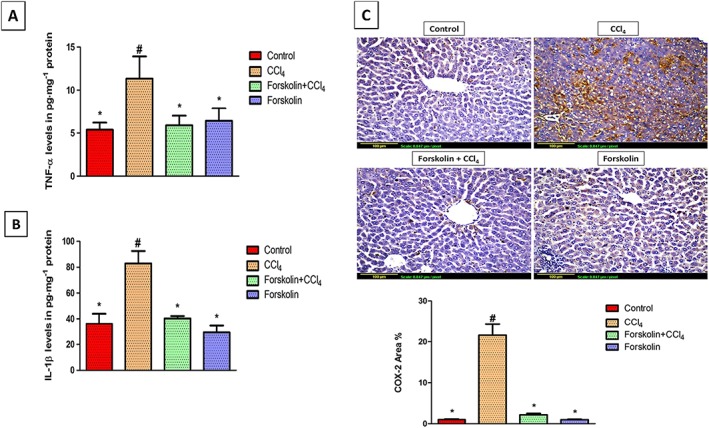
Figure 2.

Forskolin treatment reduced inflammation associated with CCl4‐induced liver fibrosis. (A,B) Effect of forskolin on hepatic (A) TNF‐α levels and (B) IL‐1β levels. Each column represents mean ± SD (n = 7). (C) Immunohistochemical detection of COX‐2 (×200). Control and forskolin‐only treated groups showing minimal COX‐2 expression. CCl4 group showing extensive COX‐2 expression (brown stain). Forskolin + CCl4 group showing less COX‐2 expression. Quantitative image analysis for immunohistochemical staining of COX‐2 expressed as percentage of stained area averaged across six different fields for each rat of at least five rats. Each column represents mean ± SD. # P <0.05; significantly different from control group; * P <0.05; significantly different from CCl4 group; ANOVA followed by Tukey–Kramer post hoc test.
