Figure 1.

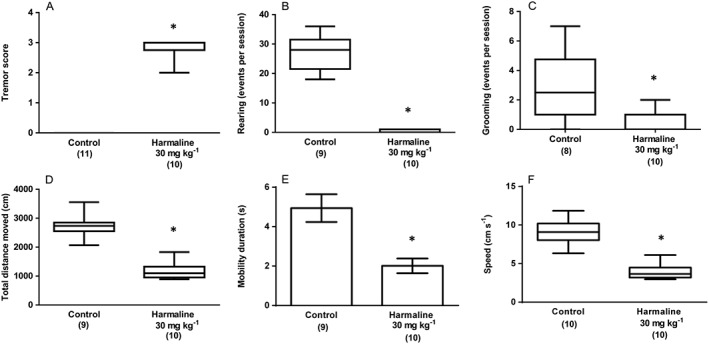
Experiment 1: The effect of harmaline (30 mg kg−1; i.p.) on (A) tremor score, (B) rearing events per session and (C) grooming events per session. Results from the same treatment in the open field test are shown as (D) total distance moved (cm), (E) mobility duration (s) and (F) movement speed (cm s−1). Data describing mobility duration exhibited a normal distribution and are represented as mean ± SEM. Data describing tremor score, rearing events, grooming events, total distance moved and movement speed were not normally distributed and are represented as medians with interquartile ranges as a box and maxima/minima as whiskers. * P < 0.05, significantly different from the vehicle (distilled water; i.p.) treated group. Numbers in parentheses indicate group sizes. No data points were excluded as outliers in the presented analyses.
