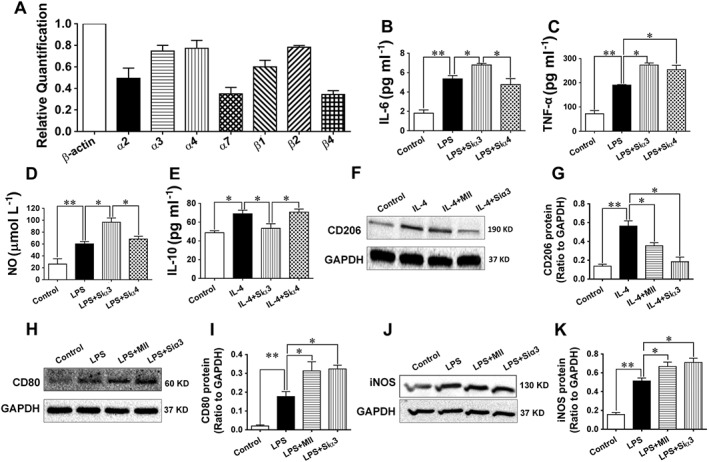
Figure 6.

Effect of the α3‐nAChR antagonist α‐conotoxin MII on the inflammatory response in macrophages. (A) Expressions of the subunits of nAChRs in the mouse macrophage (RAW 264.7, relative to β‐actin). (B–E) The LPS (100 ng·mL−1)‐stimulated secretion of the indicators, IL‐6, NO and TNFα, for the M1 (classical) type polarization of the macrophages, and the IL‐4 (25 ng·mL−1)‐stimulated secretions of the indicator, IL‐10, for the M2 (alternative) type polarization of the macrophages after cells were knocked down with the gene of the α3‐nAChR or the α4‐nAChR. (F–K) Western blotting results of the IL‐4‐stimulated expression of the indicator, CD206, for the M2 (alternative) type polarization of the macrophages and the LPS‐stimulated expression of the indicators, CD80 and iNOS, for the M1 (classical) type polarization of the macrophages after cells were stimulated with IL‐4 or LPS in the presence of MII or after cells were knocked down with the gene of the α3‐nAChR. Values are means ± SEM. Data were obtained from six separate experiments (n = 6). Significance of the difference between groups is indicated as follows: * P < 0.05; ** P < 0.01.
