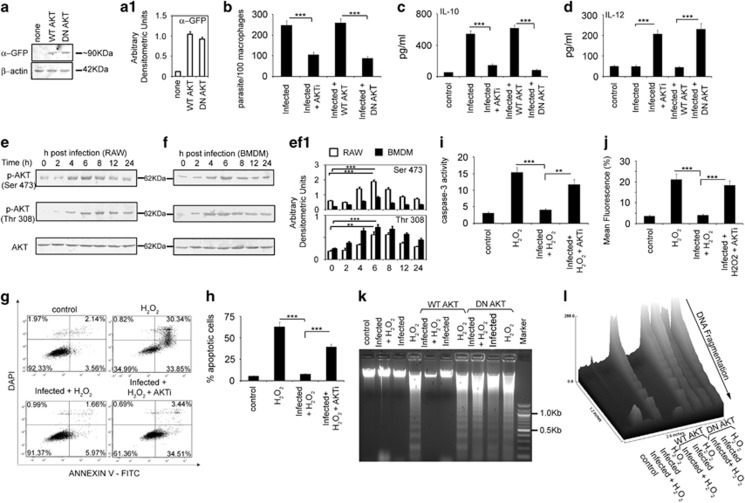
Figure 1.
Role of AKT in L. donovani infection. (a–d) RAW264.7 cells (2 × 10⁶) were treated with either AKTi (10 μM) for 1 h or transiently transfected with WT- or DN-AKT expression plasmids for 24 h. Both these macrophages were then infected with L. donovani promastigotes (macrophage:parasite ratio, 1:10) for 24 h. Expression of GFP in transfected cells were detected by Western blotting (a) and intracellular parasite number (b) were determined by DAPI staining whereas levels of IL-10 (c) and IL-12 (d) were measured by ELISA. (e and f) Both RAW264.7 (e) and BMDM (f) were infected with L. donovani promastigotes for different time periods as indicated. Levels of phosphorylated and total AKT were then detected by Western Blotting. (g–j) RAW cells were treated with AKTi for 1 h, infected with L. donovani promastigotes for 6 h and then treated with 400 μM H2O2 for 1 h. These cells were analyzed for the extent of apoptosis by annexin V-tagged FITC-DAPI flow cytometry after washing and incubation for 24 h at 37 °C (g and h). Dual parameter dot plot of FITC fluorescence (x axis) versus DAPI fluorescence (y axis) is represented as logarithmic fluorescence intensity. Quadrants are as follows: upper left, necrotic cells; lower left, live cells; lower right, apoptotic cells; upper right, necrotic or late phase of apoptotic cells. After washing, whole cell lysate of these cells (10 μg of protein per sample) were used to determine caspase-3 activity using Ac-DEVDpNA as substrate (i). Mitochondrial integrity was measured in these AKTi treated infected-H2O2 treated cells after incubation with DiOC6 (40 nM) for an additional 30 min (j). (k) RAW264.7 cells were transiently transfected with either WT- or DN-AKT expression plasmids, infected with L. donovani promastigotes for 6 h and then treated with H2O2 (400 μM) for 1 h. DNA fragmentation profile was analyzed by agarose gel electrophoresis.(l) A representative surface plot analyzed by using ImageJ software indicates the extent of fragmentation. All experiments were repeated at least three times each and one set of representative data is shown. Bands were analyzed densitometrically and bar graphs expressing arbitrary densitometric units are presented adjacent to corresponding western blots. Error bars represent mean±S.D., n=3.**P<0.01, ***P<0.001; Student's t-test

