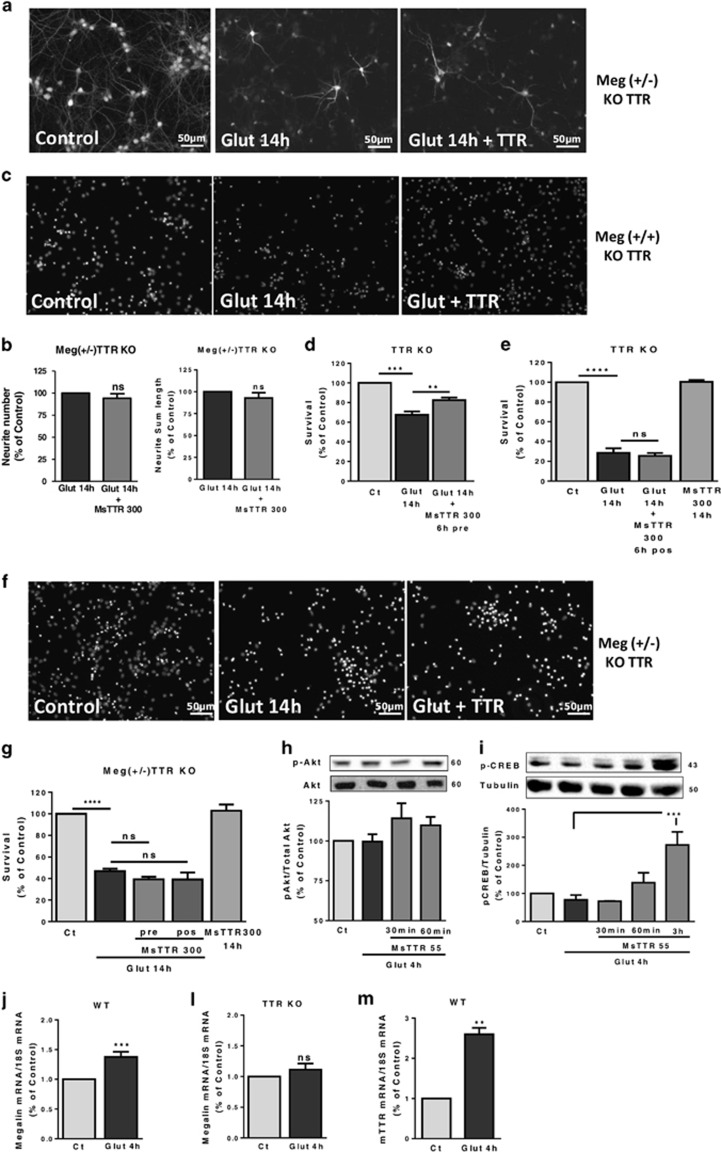
Figure 5.
TTR promotes neuronal survival, through a megalin-dependent manner. (a) Megalin (+/−) TTR KO cultured hippocampal neurons (7 DIV) were subjected to excitotoxic stimulation with glutamate (125 μM glutamate, 20 min) and further incubated in culture-conditioned medium with recombinant mouse TTR (300 μg/ml) for 14 h, and stained for MAP2. Representative images are shown (a) and neurite number and neurite sum length were quantified with ImageJ software (b). The results are the average±S.E.M. of nine independent experiments. (c) TTR KO cultured hippocampal neurons (7 DIV) were subjected to excitotoxic stimulation with glutamate (125 μM glutamate, 20 min), with a 6 h pre-incubation with recombinant mouse TTR (300 μg/ml) in culture-conditioned medium. Cell survival was accessed 14 h after the excitotoxic insult, using the fluorescent dye Hoechst 33342 (c, representative images; d). The results are the average±S.E.M. of five independent experiments. In (e), a similar experimental design as in (b) was used, but adding mouse TTR (300 μg/ml) after the excitotoxic stimulus. The results are the average±S.E.M. of four independent experiments. (g) Using the same approach used as in (d) and (e), but using megalin (+/−)TTR KO cultured hippocampal neurons (7 DIV), mouse TTR (300 μg/ml) was added before and after the excitotoxic stimulus. The results are the average±S.E.M. of five independent experiments (f). To address TTR signaling activity after the excitotoxic stimulation, mouse TTR was added to TTR KO hippocampal cultures (7 DIV), 4 h after a glutamate stimulus (125 μM glutamate, 20 min) and Akt (Ser473) (h, n=3) and CREB phosphorylation (Ser133) (i, n=3–5) were analyzed by western blot at several time points (30 min, 60 min, 3 h). Megalin mRNA levels were also accessed after an excitotoxic insult (125 μM glutamate, 20 min) in WT cultured hippocampal neurons (7 DIV) (j, n=5) and in TTR KO cultured hippocampal neurons (7 DIV) (l, n=9). TTR mRNA levels were also analyzed after an excitotoxic insult (125 μM glutamate, 20 min) in WT cultured hippocampal neurons (7 DIV) (m, n=4). The results are the average±S.E.M. of four to five independent experiments. Statistical analysis was performed using one-way ANOVA followed by Bonferroni's multiple comparison test performed for each condition as compared with the control or as indicated or Student's unpaired t-test for two-groups only analysis. ***P<0.001, **P<0.01, *P<0.05, n.s., not significant. All the scale bars presented correspond to 50 μm

