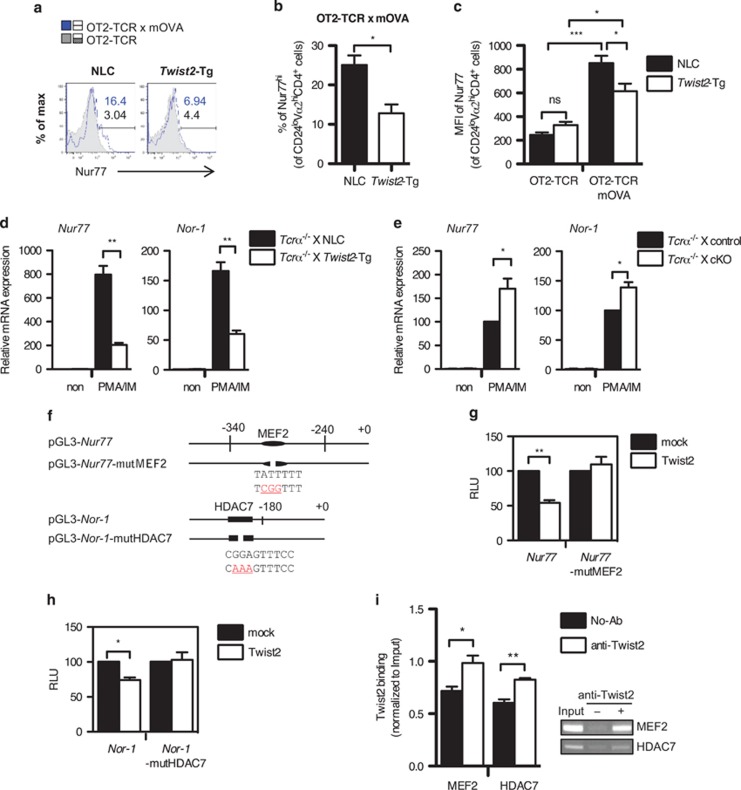
Figure 6.
Twist2 regulates the expression of Nur77 and Nor-1. (a–c) The expression level of Nur77 in the CD24loVα2hiCD4+ population was analyzed by flow cytometry using intracellular staining. Numbers indicate the percentage of Nur77hi cells in each population (blue solid line: OT2-TCR × mOVA-Tg, gray tinted line: OT2-TCR-Tg) (a). The percentage of Nur77hi cells (b) and the MFI of Nur77 (c) in the indicated mice are summarized (error bars, ±S.E.M., n=3). (d and e) The expression of Nur77 and Nor-1 was detected using qPCR in thymocytes from NLC and Twist2-Tg mice (d) or control and cKO mice (e) after stimulation with PMA and IM (PMA/IM). All mice were crossed with Tcrα−/− mice to preclude TCR-experienced thymocytes. The expression of Nur77 and Nor-1 expression is normalized to β-actin expression, and the results are presented relative to non-stimulated respective control thymocytes (error bars, ±S.E.M.). (f) Schematic diagrams of the Nur77 and the Nor-1 promoter constructs used in luciferase assay. Mutated sequences in each promoter are indicated in red color. (g and h) Twist2 expression vector was co-transfected into 16610D9 cells with Nur77 and Nur77-mutMEF2 promoter constructs (g) or Nor-1 and Nor-1-mutHDAC7 promoter constructs (h). Luciferase activities were detected after the PMA/IM treatment. The results are presented relative to the promoter activity in mock-transfected cells (error bars, ±S.E.M.). (i) ChIP assay was performed in thymocytes from DO-TCR × Twist2-Tg mice. The binding of Twist2 to the promoters of Nur77 and Nor-1 was detected by semi-qPCR. The band intensity was quantified using the ImageJ software (National Institutes of Health, Bethesda, MD, USA) and normalized to Input (error bars, ±S.E.M.)

