Figure 5.
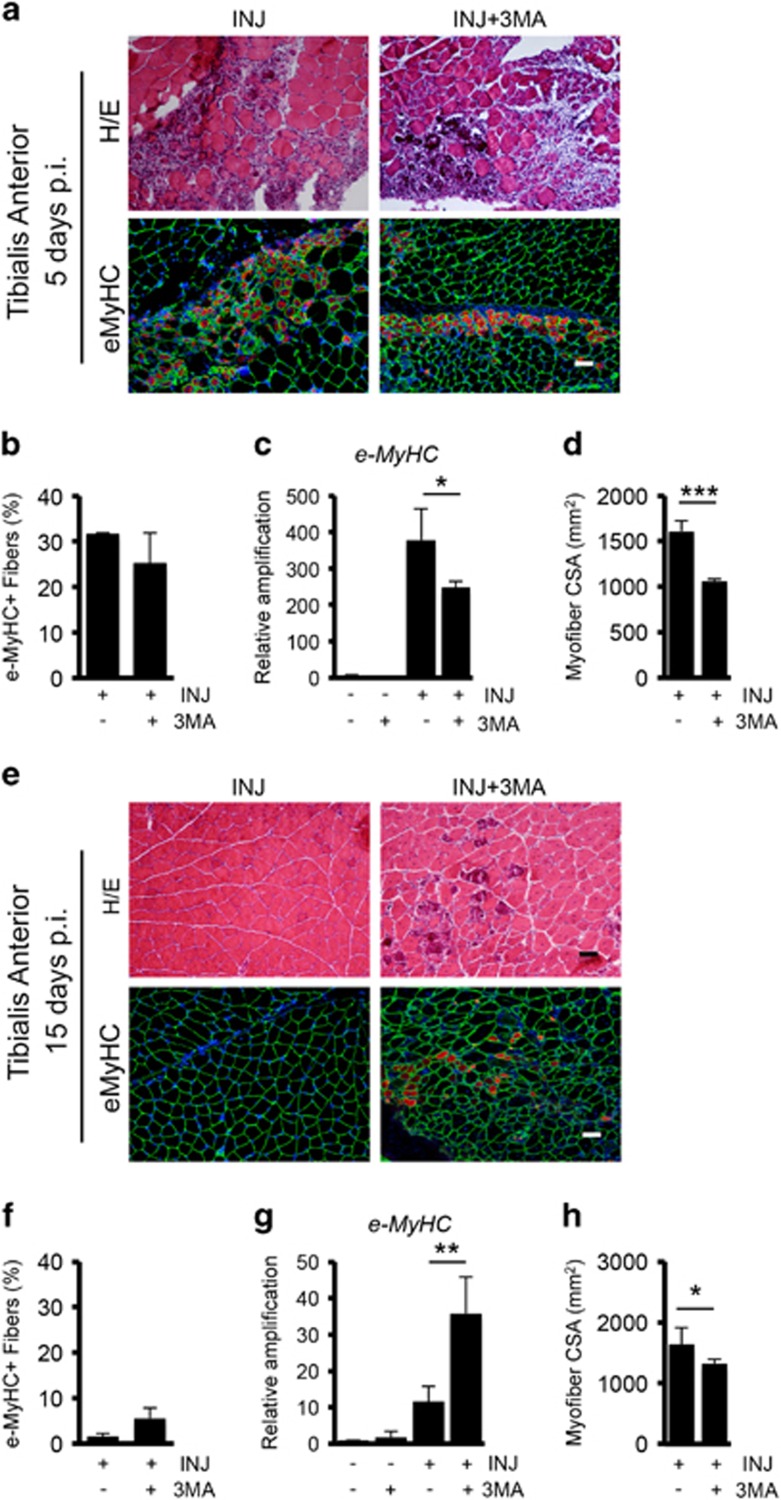
The inhibition of autophagy reduces muscle repair. (a, top) Representative images of Hematoxilin/Eosin (H/E) staining on TA sections from injured WT mice treated or not with 3-MA (10 mg/kg daily i.p. injection for 5 days) analyzed 5 days p.i., n=3 for each experimental group. (bottom) Immunostaining for eMyHC (red) and Laminin (green) on TA sections from injured WT mice treated or not with 3-MA for 5 days analyzed at 5 days p.i. Nuclei were counterstained with DAPI (blue). (b) Plot representing the percentage of eMyHC based on the average of six fields for each sample. (c) qRT-PCR analysis of eMyHC gene expression analyzed in uninjured and injured WT mice treated or not with 3-MA and harvested 5 days p.i. (d) Quantification of average myofiber CSA 5 days after injury based on the average of six fields for each sample. (e, top) Representative images of H/E staining on TA sections from injured WT mice treated or not with 3-MA (10 mg/kg daily i.p. injection for 15 days) analyzed 15 days p.i. n=3 for each experimental group. (bottom) Immunostaining for eMyHC (red) and laminin (green) on TA sections from injured WT mice treated or not with 3-MA for 15 days analyzed 15 days p.i. (f) Plot representing the percentage of eMyHC based on the average of six fields for each sample. (g) qRT-PCR analysis of eMyHC gene expression analyzed in uninjured and injured WT mice treated or not with 3-MA and harvested 15 days p.i. (h) Quantification of average myofiber CSA 15 days after injury based on the average of six fields for each sample. Scale bar, 50 μm. Statistical significance assessed by t-test, *P≤0.05, **P≤0.01, ***P≤0.001

