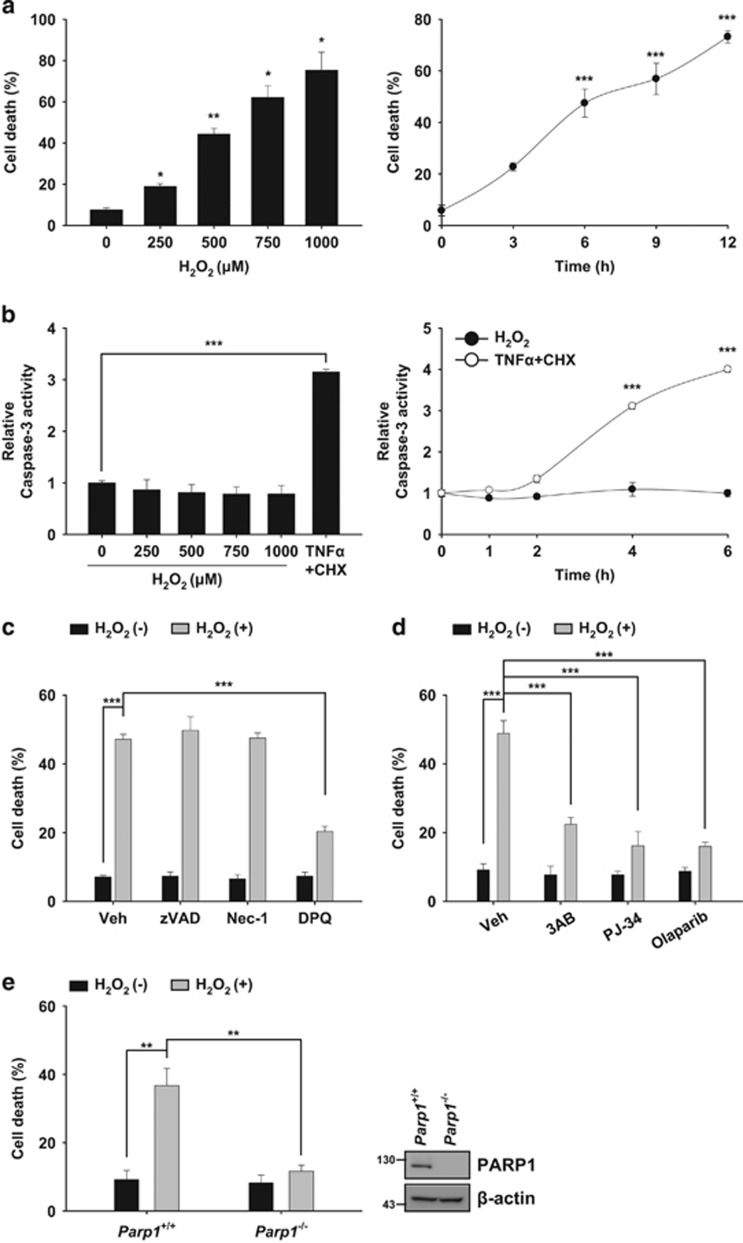
Figure 1.
H2O2 induces PARP1-dependent necrosis in MEFs. (a) Left panel: wild-type (WT) MEFs were treated with the indicated concentrations of H2O2 for 6 h. Right panel: WT MEFs were treated for indicated times with 500 μM H2O2. Cell death was determined on the basis of LDH release (n=3). (b) Left panel: WT MEFs were treated with the indicated concentrations of H2O2 or TNFα (50 ng/ml) plus CHX (20 μg/ml) for 4 h and were then analyzed for caspase-3 activity (n=3). Right panel: WT MEFs were treated with 500 μM H2O2 or TNFα (50 ng/ml) plus CHX (20 μg/ml) for the indicated times and were analyzed for caspase-3 activity. Graphs represent the relative activity of caspase-3 compared with the respective controls (n=3). (c) WT MEFs were pretreated with zVAD-fmk (100 μM), Nec-1 (50 μM) or DPQ (30 μM) for 1 h and were then treated with 500 μM H2O2 for 6 h in the presence of individual compounds. Cell death was determined by measuring LDH release (n=3). (d) WT MEFs were pretreated with 3AB (2 mM), PJ-34 (20 μM) or Olaparib (10 μM) for 1 h and were then treated with 500 μM H2O2 for 6 h in the presence of individual compounds. Cell death was determined on the basis of LDH release (n=3). (e) Left panel: Parp1+/+ and Parp1−/− MEFs were treated with 500 μM H2O2 for 6 h. Cell death was determined on the basis of LDH release. Right panel: representative immunoblots show the levels of PARP1 and β-actin expression (n=3). All the data are expressed as the mean±S.E.M. from three independent experiments. Statistical comparisons were evaluated by ANOVA test followed by Games–Howell (Left panel a) or Tukey HSD (Right panel a, b–e) post hoc analysis. ***P<0.001, **P<0.01 and *P<0.05

