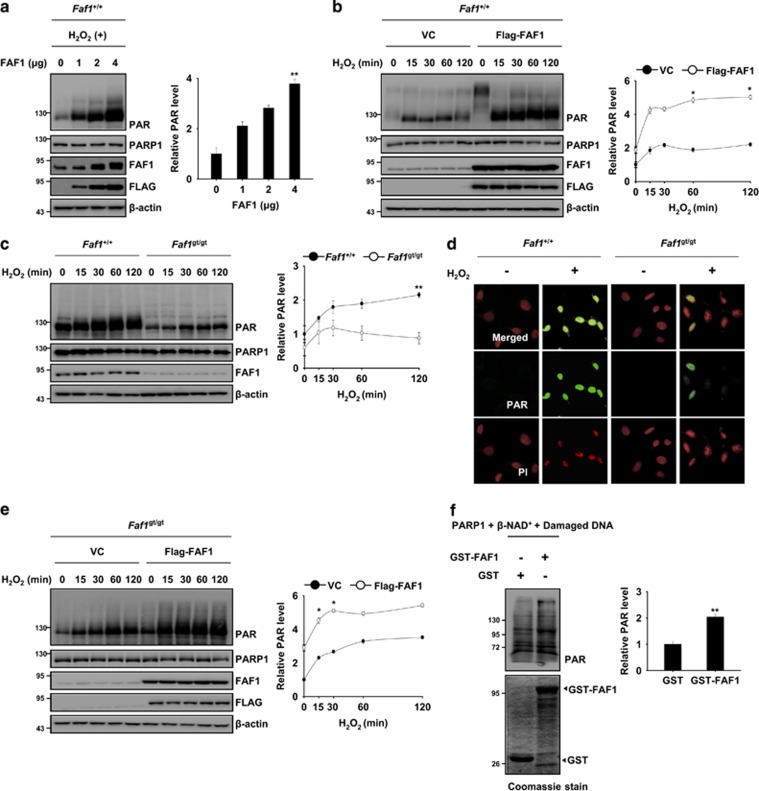
Figure 4.
FAF1 promotes the catalytic activity of PARP1 during oxidative stress. (a) Left panel: WT MEFs were transfected with the indicated concentration of Flag-FAF1 plasmids. At 36 h after transfection, the cells were treated with 500 μM H2O2 for 30 min. The cell lysates were immunoblotted with the indicated antibodies. Right panel: the graph shows the result of densitometric analysis of PAR immunoblots (n=3). (b) Left panel: WT MEFs were transfected with the VC or Flag-FAF1 plasmids. At 36 h after transfection, the cells were treated with 500 μM H2O2 for the indicated times. The cell lysates were immunoblotted with the indicated antibodies. Right panel: the graph shows the result of densitometric analysis of PAR immunoblots (n=3). (c) Left panel: Faf1+/+ and Faf1gt/gt MEFs were treated with 500 μM H2O2 for the indicated times. The cell lysates were subjected to immunoblot analysis with the indicated antibodies. Right panel: the graph shows the result of densitometric analysis of PAR immunoblots (n=3). (d) Faf1+/+ and Faf1gt/gt MEFs were treated with 500 μM H2O2 for 30 min and were then immunostained with the anti-PAR antibody. The nuclei were stained using PI and the cells were analyzed by confocal microscopy. (e) Left panel: Faf1gt/gt MEFs were transfected with the VC or Flag-FAF1 plasmids. Thirty-six hours after transfection, the cells were treated with 500 μM H2O2 for the indicated times. The cell lysates were subjected to immunoblot analysis with the indicated antibodies. Right panel: the graph shows the result of densitometric analysis of PAR immunoblot (n=3). (f) Left panel: GST-FAF1 or GST was incubated with recombinant PARP1 (1 unit), β-NAD+ (100 μM) and damaged DNA for 10 min at room temperature. After the in vitro poly(ADP-ribosyl)ation reactions, the samples were subjected to immunoblot analysis. Right panel: the graph shows the results of densitometric analysis of PAR immunoblots (n=3). Quantified data (a–c, e, f) are expressed as the mean±S.E.M. from three independent experiments. Statistical comparisons were evaluated by ANOVA test followed by Tukey HSD (a–c, e, f) post hoc analysis. **P<0.01 and *P<0.05

