Figure 7.
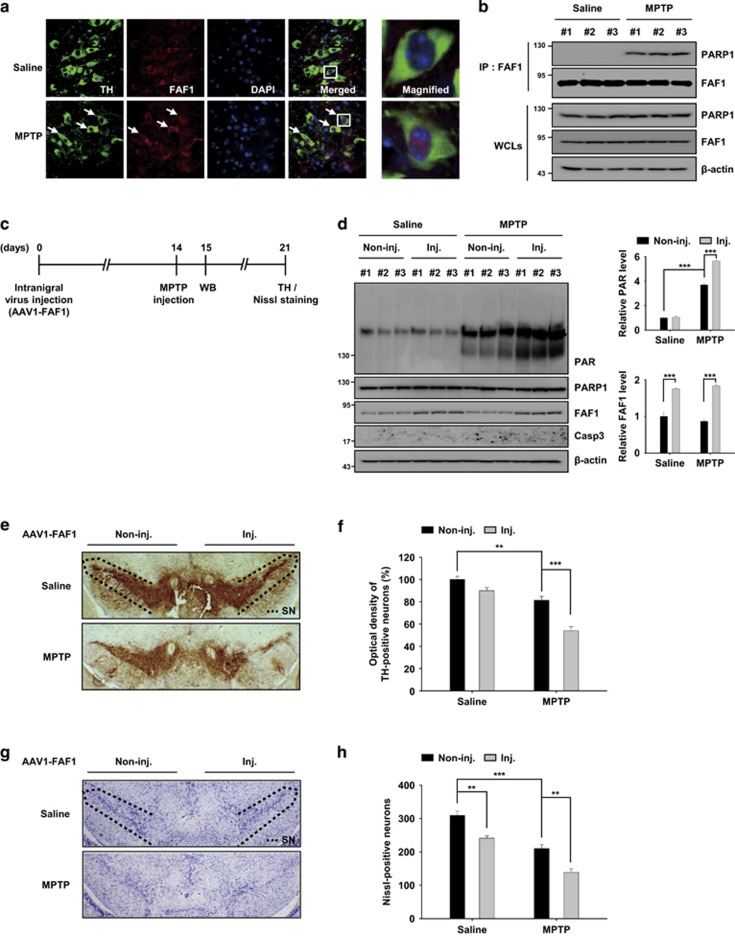
FAF1 promotes dopaminergic neuronal cell death via PARP1 activation in an MPTP mouse model of PD. (a and b) The mice were administered four intraperitoneal injections of MPTP-HCl or saline at 2 h intervals. The mice were killed 24 h after the last injection. (a) Left panel: the subcellular localization of FAF1 was measured by immunofluorescence staining in TH-positive neurons of substantia nigra of mice that were treated with saline or MPTP. The nuclei were stained using DAPI and the tissues were analyzed by confocal microscopy. The white arrows indicate the presence of nuclear FAF1 in TH-positive neurons after MPTP treatment. Right panel: enlarged images of TH-positive neurons were taken from the white box in the merged images. (b) Brain lysates were prepared from the ventral midbrain of saline and MPTP-treated mice and were then subjected to immunoprecipitation with the anti-FAF1 antibody followed by immunoblotting with the indicated antibodies (n=3 per group). (c) The experimental scheme for panel d–f. The mice were injected unilaterally into the substantia nigra (SN) with adeno-associated virus type 1 (AAV1)-FAF1. Two weeks after AAV1-FAF1 injection, the mice were administered MPTP-HCl or saline, at 2 h intervals. The mice were killed 1 day and 7 days after the last MPTP injection and their brain tissues were prepared for western blot (WB) analysis or immunohistochemistry. (d) Left panel: at day 1 after the last MPTP injection, brain lysates were prepared from the ventral midbrain of the AAV1-FAF1-injected (inj.) or non-injected (non-inj.) side of saline- and MPTP-treated mice and were then subjected to immunoblot analysis using the indicated antibodies. Right panel: the graphs show the results of densitometric analysis of PAR and FAF1 immunoblots in left panel (n=3 per group). (e and g) At day 7 after the last MPTP injection, the dopaminergic neurodegeneration was measured by histological analysis for TH-positive (e) and Nissl-positive cells (g) in SN of the AAV1-FAF1 injected (inj.) or non-injected (non-inj.) side of saline- and MPTP-treated mice. Dashed lines represent a region of SN. (f) The graph shows the results of densitometric analysis of TH-stained neurons in e (n=5 per group). (h) The graph shows the counts of Nissl-stained cells in g (n=5 per group). Quantified data (d, f, h) are expressed as the mean±S.E.M. Statistical comparisons were evaluated by ANOVA test followed by Tukey HSD post hoc analysis. ***P<0.001, **P<0.01

