Figure 5.

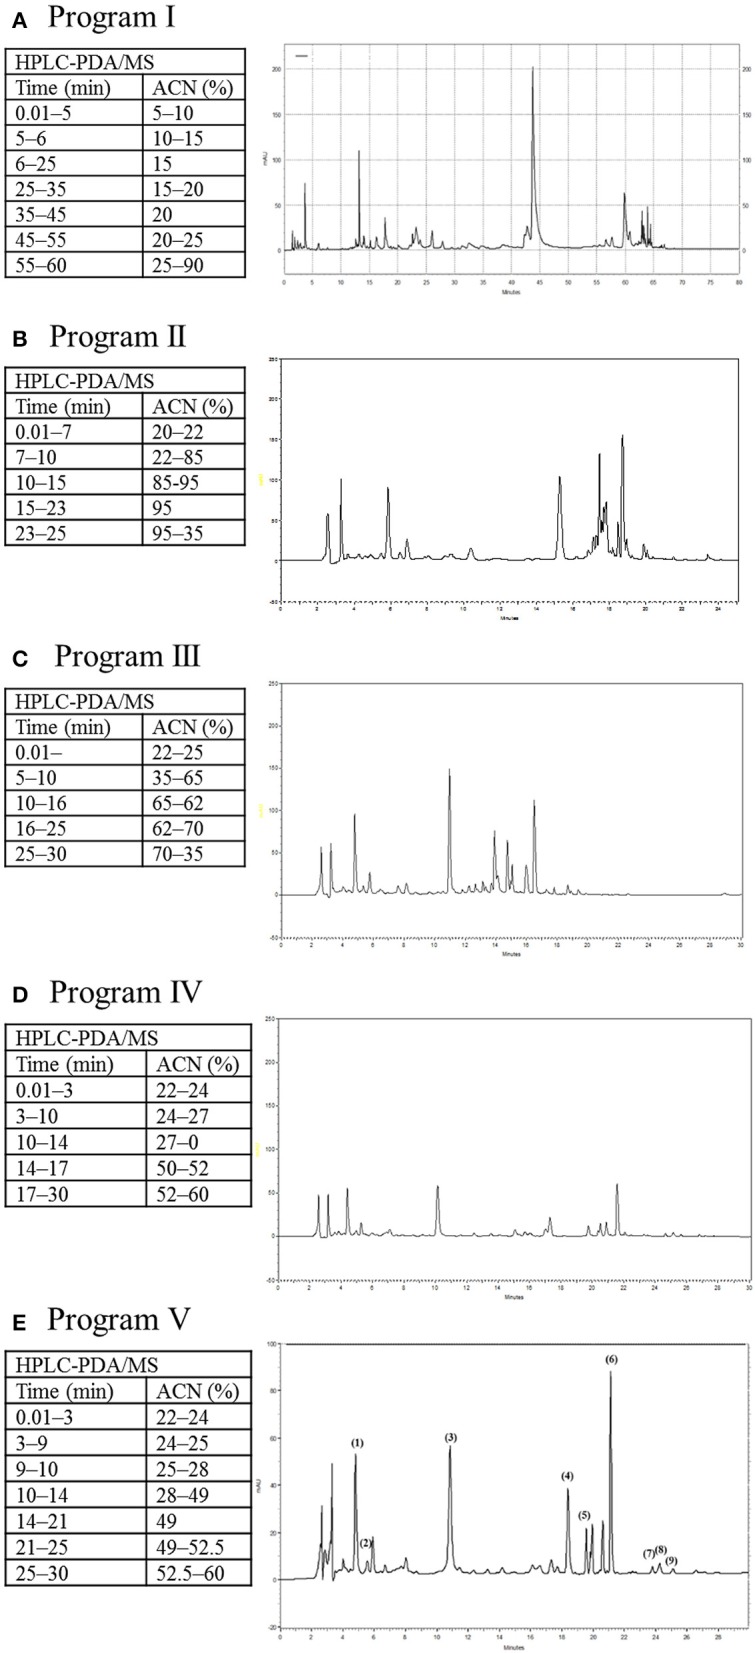
Effects of five different gradient elution programs on the migration of analytes (0.50 μg/mL each). HPLC profiles of (A) Program I, (B) Program II, (C) Program III, (D) Program IV, (E) Program V were demonstrated.

Effects of five different gradient elution programs on the migration of analytes (0.50 μg/mL each). HPLC profiles of (A) Program I, (B) Program II, (C) Program III, (D) Program IV, (E) Program V were demonstrated.