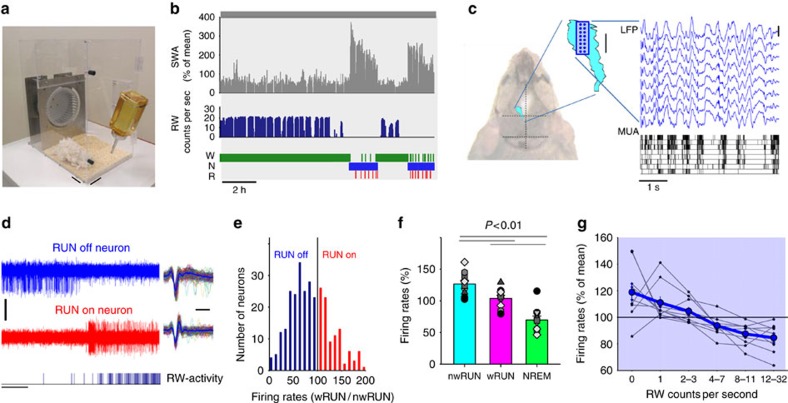
Figure 1. Cortical neuronal activity in the primary motor cortex (M1) during voluntary wheel running in freely behaving mice.
(a) A photograph of the custom-made cage providing continuous free access to a running wheel positioned at the rear. Scale bars, 5 cm. (b) From top to bottom: 12-h profile of EEG slow-wave activity (SWA, EEG power between 0.5–4.0 Hz, represented as % of 12-h mean) recorded in the frontal cortex, running-wheel (RW) activity (counts per second) and the distribution of sleep-wake stages (W=wakefulness, N=NREM sleep, R=REM sleep) from a representative mouse. (c) Schematic representation of the position of the primary motor cortex (M1, blue area drawn with reference to Paxinos & Franklin, 2001) shown on the dorsal surface of the mouse head, and the position of the 16-ch microwire array above M1 (dots indicate the position of individual wires within the array, scale bar, 1 mm). Traces on the right: top, representative local field potentials (LFP) recorded during NREM sleep from one row of microwires; bottom, raster plot of multiunit activity (MUA, each vertical line represents a spike) recorded from the same wires (scale bar, 500 μV). Note the close temporal relationship between positive LFP waves and periods of generalized neuronal silence. (d) Two MUA traces recorded from M1 in the same animal with corresponding RW-activity (bottom, each vertical bar represents a single wheel rung count, scale bars, amplitude 100 μV, time 1 s). Corresponding waveforms of the action potentials recorded extracellularly are shown on the right (scale bar, 0.5 ms). (e) The distribution of all putative single units recorded in n=11 mice as a function of the ratio of their average firing rates (FR) during running (wRUN) and non-running waking (nwRUN). Note that a smaller proportion of neurons increase firing during wheel running (red, RUN on neurons), while the majority decrease FR during running (blue, RUN off neurons). (f) Average FR in M1 during nwRUN waking, wRUN waking and NREM sleep. Mean values, s.e.m., n=11 (individual mice: grey symbols). Significant differences between vigilance states are depicted above the bars (obtained by two-tailed paired t-test following significant one-way ANOVA). (g) FR in M1 shown as function of running speed. Thick line: mean values, s.e.m., n=9 mice. Values from individual animals are shown as thin line plots.

