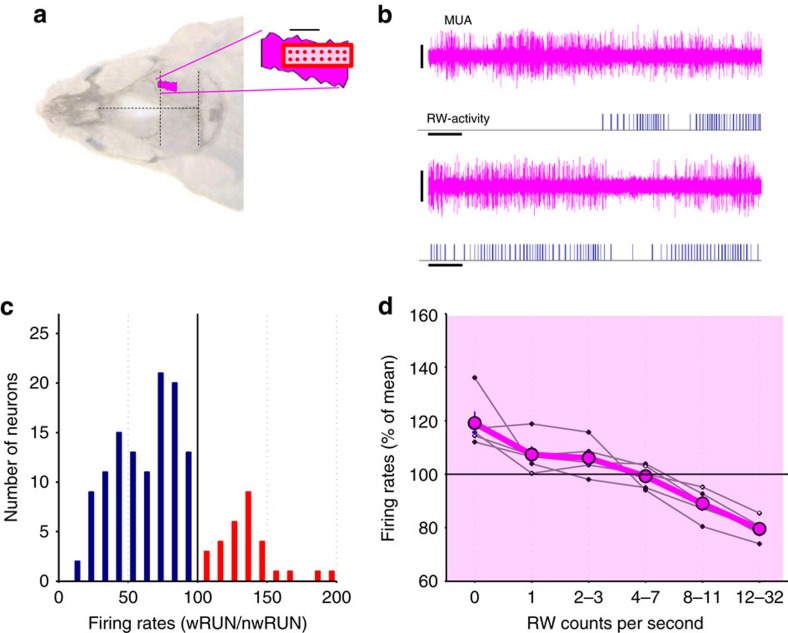
Figure 2. Cortical neuronal activity in the somatosensory cortex (SCx) during voluntary wheel running.
(a) Schematic representation of the position of the 16-ch microwire array shown relative to the barrel cortex (drawn in reference to Paxinos & Franklin, 2001) shown on the dorsal surface of the mouse head (dots indicate the position of individual wires within the array, scale bar, 1 mm). (b) Individual representative examples depicting multiunit activity (MUA) in SCx during wheel running (scale bars: amplitude 100 μV, time 1 s). Corresponding running wheel (RW)-activity is shown below each trace (each vertical bar represents a single wheel rung count). (c) The distribution of all putative single units recorded in SCx (in n=5 mice) as a function of the ratio of their average firing rates (FR) during running (wRUN) and non-running waking (nwRUN). Note that a smaller proportion of neurons increase FR during running (red), while the majority decrease spiking activity (blue). (d) FR in SCx shown as a function of running speed (counts per second). Thick line: mean values, s.e.m., n=5 mice. Values from individual animals are shown as thin line plots.

