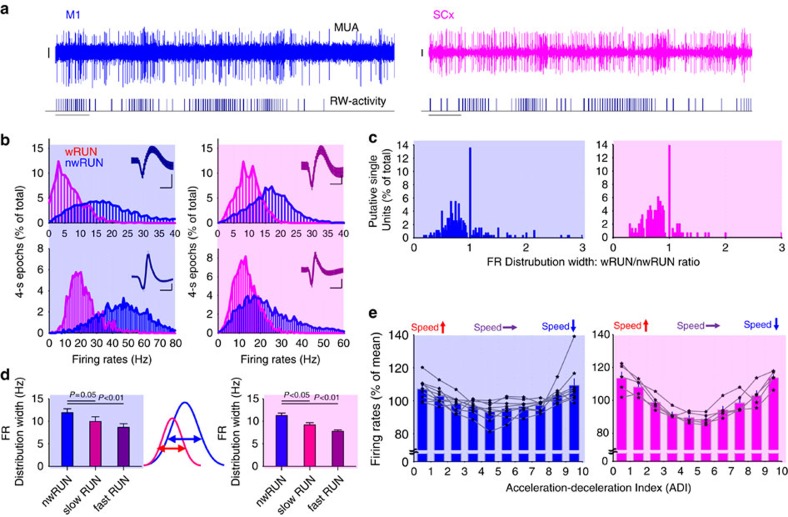
Figure 3. The relationship between cortical neuronal activity and changes in wheel running speed.
(a) Individual examples depicting cortical firing rates (FR) in the motor cortex (M1) and somatosensory cortex (SCx) modulated by running wheel behaviour. From top to bottom: MUA recorded in one representative channel of the 16-channel array, and running-wheel (RW)-activity (each vertical bar represents a single wheel rung count, scale bars, amplitude 50 μV, time 1 s). Note the irregular pattern of spiking associated with variability in running speed. (b) The distribution of 1-s epochs as a function of firing rates during wRUN and nwRUN waking. Four individual putative single units are shown. Blue background relates to data recorded in M1, pink background relates to data recorded in SCx. Note that running is associated with a substantial shift in the distribution of firing rates. Insets: corresponding spike wave forms (scale bars, amplitude 50 μV, time 0.5 ms). (c) The distribution of all putative single units recorded in M1 (n=9 mice) and SCx (n=5 mice) as a function of the ratio of the width of FR distribution during wRUN and nwRUN waking. Note that the majority of neurons have narrower distribution of FRs during wRUN waking in both M1 and SCx. (d) The effect of wheel running speed on the width of FRs distribution. Left and right panels: mean values for M1 and SCx, respectively. The curves in the middle schematically depict the procedure for calculating the width of FRs distributions at ½ of their height. Values above depict P values of paired t-test (after Bonferroni's correction). (e) Cortical FR in M1 (blue) and SCx (pink) shown as a function of the wheel acceleration–deceleration index. All 1-s epochs were subdivided into ten 10% deciles, each consisting of the same number of epochs. These were sorted as a function of the change in wheel running speed within an epoch from fast acceleration to fast deceleration (schematically shown as arrows above), and corresponding average FR were calculated before averaging between animals. Mean values, s.e.m., M1: n=9 mice, SCx: n=5. Mean values are shown as bar plots, the individual values from individual animals are shown as thin line plots.

