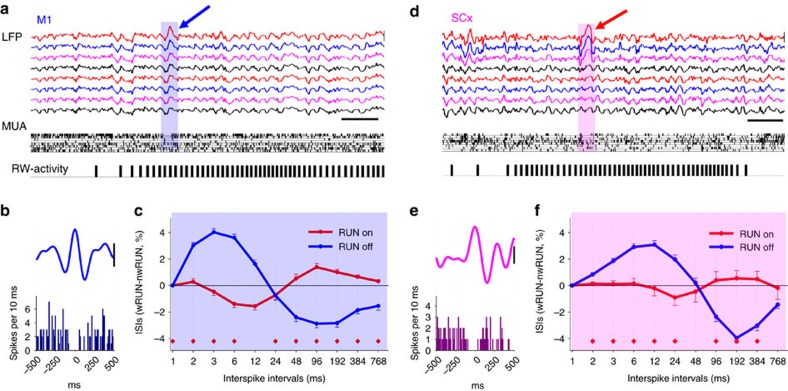
Figure 4. Cortical activity during voluntary wheel running.
(a) Top traces show representative local field potentials (LFP, 0.1–100 Hz) in eight channels of the 16-channel microwire array placed in the primary motor cortex (M1). Middle: raster plot of multiunit activity (MUA) recorded in the same eight channels (each vertical line represents a spike). Bottom: corresponding running-wheel (RW)-activity (each bar represents a single wheel rung count). Note that a positive LFP wave is accompanied by reduced MUA in corresponding channels (scale bars, amplitude 500 μV, time 0.5 s). (b) Individual representative example of a positive LFP slow (2–6 Hz) wave recorded with one individual wire of a 16-channel microwire array during wheel running. Bar plot below shows corresponding MUA (scale-bar: 200 μV). (c) The distribution of interspike intervals (ISIs) as a function of wheel running behaviour. The number of ISIs calculated as a function of logarithmically increasing ISI duration bins, plotted against their lower limits. For each putative single unit ISIs were calculated during wRUN and nwRUN waking, and the difference between the two states was calculated separately for RUN on and RUN off neurons. Mean values, s.e.m., n=9 mice (red diamonds, P<0.05, paired t-test). Note a relative predominance of short ISIs during running among RUN off neurons, compared with nwRUN waking and RUN on neurons. (d,e,f) The same analysis for SCx. Mean values, s.e.m. (n=5 mice).

