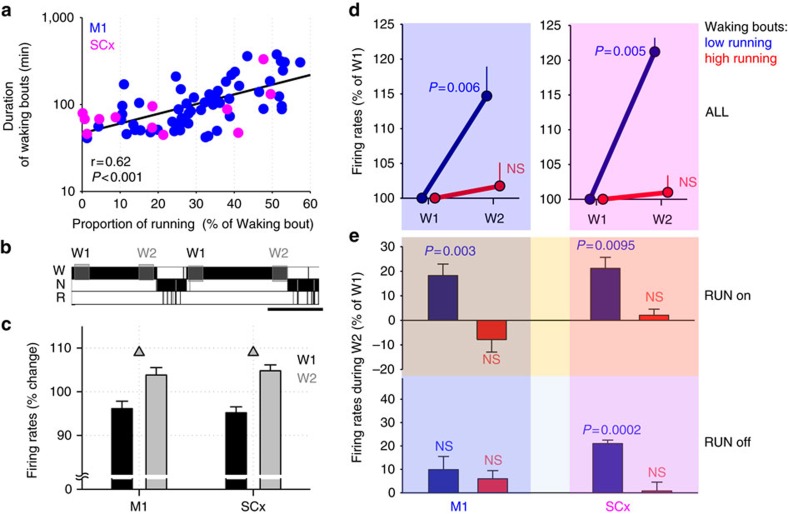
Figure 5. Longer-term effects of wheel running on cortical firing rates.
(a) The relationship between the proportion of time spent running during a period of spontaneous waking and the duration of the corresponding waking period. Each dot corresponds to an individual waking period. The data are shown separately from animals implanted in M1 (n=11) and SCx (n=5). Note that a higher proportion of running is associated with longer waking periods. (b) Sleep-wake stages (W=wakefulness, N=NREM sleep, R=REM sleep) from one representative mouse showing two consolidated spontaneous waking periods. Shaded areas indicate the 15-min time intervals used for comparison between the beginning (W1) and end (W2) of waking periods >40 min. Scale bar, 1 h. (c) Average firing rates (FR) during W1 and W2 represented as % of the mean value between W1 and W2 for each putative single unit. Note that on average spontaneous cortical FR increased significantly (triangles, P<0.05, paired t-test) from W1 to W2 in both M1 and SCx. Mean values, s.e.m. (n=11 and n=5 animals for M1 and SCx, respectively). (d) Average FR during W1 and W2 shown separately for waking periods with a high or low amount of running (top and bottom 50% of the distribution of all waking periods, respectively = ‘high'—red, and ‘low'—blue). FR during W2 are shown as % of corresponding values during W1. Note that FR increased significantly only in the course of waking periods with low RW-activity. (e) Average FR during W2 shown as % of W1 shown separately for RUN on neurons (top) and RUN off neurons (bottom). As in c, blue bars correspond to waking periods with low RW-activity, and red bars correspond to waking periods with high RW-activity. NS, not significant.

