Figure 3.

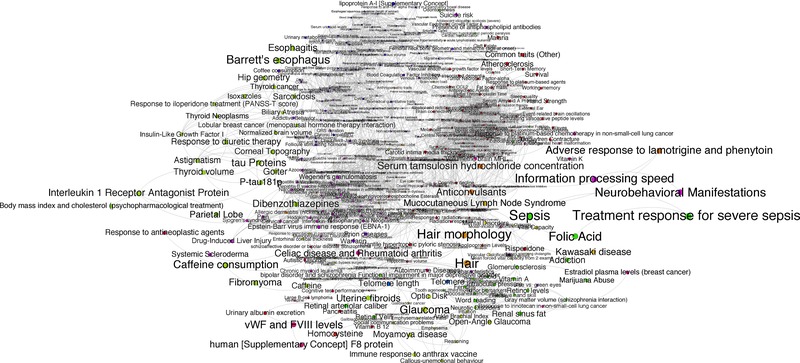
The projected HPN filtered (edge weight cutoff = 0.01). Vertices are colored by “‘modules”’ [Darabos et al., 2014c] to increase readability and are proportional to the number of associated biological pathways.

The projected HPN filtered (edge weight cutoff = 0.01). Vertices are colored by “‘modules”’ [Darabos et al., 2014c] to increase readability and are proportional to the number of associated biological pathways.