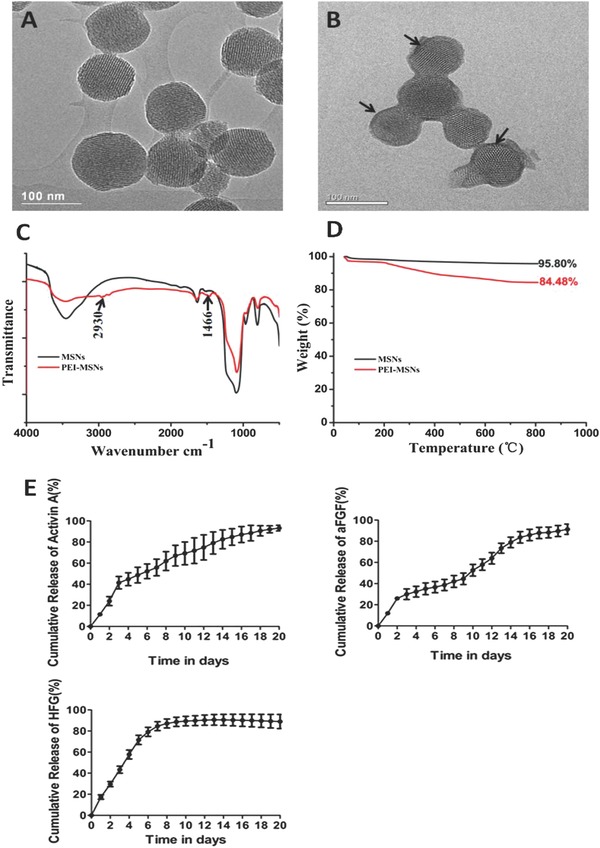
Figure 1.

TEM images of A,B) mesoporous silica nanoparticles (MSNs) and PEI‐modified mesoporous silica nanoparticles (PEI‐MSNs), black arrow: PEI coating; C) FT‐IR spectrum; D) Thermogravimetric analysis (TGA) curves of the MSNs and PEI‐MSNs, and E) The cumulative release profiles of PEI‐MSNs loaded with Activin A, aFGF, and HGF. Data are presented as means ± SD (spontaneous differentiation (control)).
