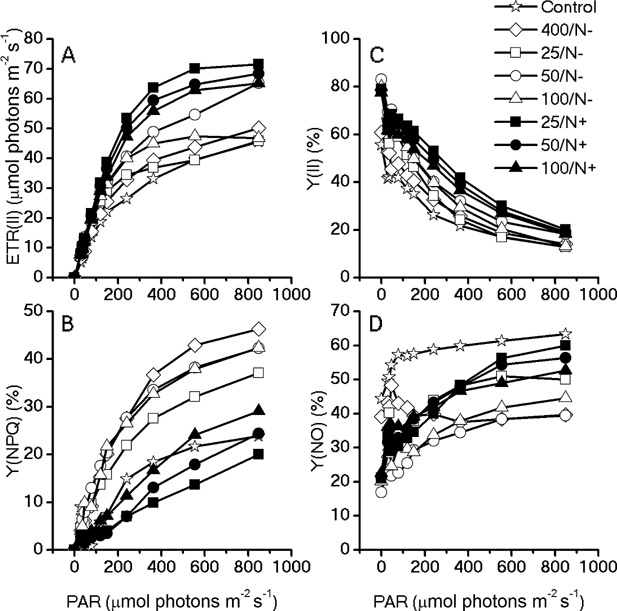
Figure 6.

Light response curves of the chlorophyll fluorometry parameters for the acclimated algae cells. Chlorophyll fluorescence were obtained with a series of photosynthetically active radiances (0, 30, 37, 46, 77, 119, 150, 240, 363, 555, 849 μmol photons m−2 s−1) to calculate (A) electron transport rate, (B) Y(NPQ), (C) Y(II), and (D) Y(NO).
