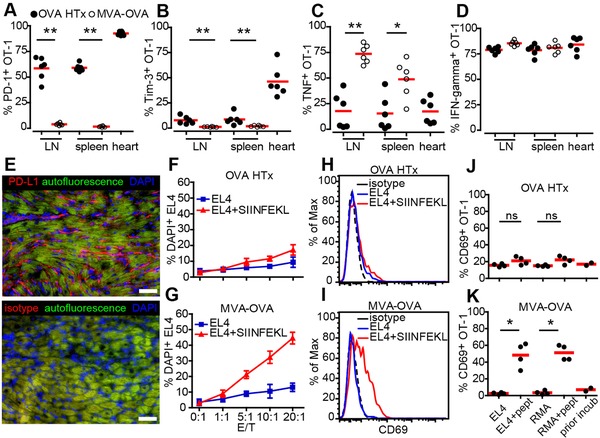
Figure 5.

Low killing capacity of heart‐OVA primed effector OT‐1 T cells is associated with high expression of PD‐1, reduced cytokine responses, and impaired in vitro cytotoxicity. (A, B) Quantification of PD‐1+ (A) and Tim‐3+ (B) OT‐1 T cells harvested from the organs indicated of transplanted (OVA HTx) or immunized (MVA‐OVA) mice. (C, D) Following in vitro re‐stimulation, the percentage of TNF‐α (C) or IFN‐γ+ (D) OT‐1 T cells has been analyzed. Each dot represents an individual mouse. (E) Expression of PD‐L1 in the grafts; scale bar, 50 μm. (F, G) OT‐1 T cells isolated from lymph nodes and spleen of transplanted (F) or MVA‐OVA‐immunized (G) recipients were cultured with SIINFEKL peptide‐loaded or unloaded EL4 cells in vitro for 4 h and the percent of DAPI+ killed targets was determined. (H‐K) OT‐1 T cells isolated from recipients post OVA HTx (H, J) or from mice challenged with MVA‐OVA (I, K) show pronounced differences regarding CD69 upregulation following culture with peptide‐loaded targets. Means ± SD (F,G); bars, means (A–D, J‐K), *p<0.05, **p<0.01, Mann–Whitney test. Data are pooled from two experiments with six mice used per experiment (A–D); from two experiments with four mice per experiment (E); from four experiments with duplicate wells (F‐G); from two experiments with duplicate wells (H–K).
