Figure 6.

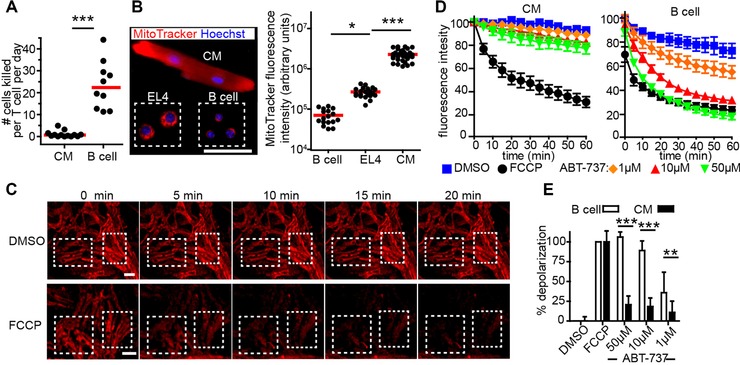
Cardiomyocytes are highly resistant to apoptosis and cytotoxic T‐cell killing. (A) B cells enriched from OVA (OVA+) and WT (OVA−) mice were injected i.v. at a 1:1 ratio into MVA‐OVA immunized μMT mice that had been transferred with GFP+ OT‐1 and OT‐2 cells 4–5 days earlier. The frequency of OVA+, OVA− B cells and OT‐1 cells was determined in spleen by FACS and the killing rate calculated. For comparison, CM data from Fig. 4I is shown. Dots represent mice; bars, median; p<0.0001, Mann–Whitney test. (B) Fluorescence microscopy of EL4 cells, B cells, and CMs stained with MitoTracker (red) and Hoechst (blue) and quantification of total cell MitoTracker fluorescence intensity. Dots represent cells; bars, mean; *p<0.05, ***p<0.001, Kruskal–Wallis and Dunn's test; scale bar 50 μm. (C) TPM of explanted CFP+ myocardium stained with JC‐1, incubated with DMSO or FCCP and imaged at time points indicated, two‐three regions of interest (white boxes) were analyzed per movie. Scale bar, 30 μm. (D) Time course of mitochondrial potential following treatment with the substances indicated. JC‐1 fluorescence intensity of CM and B cell has been determined by TPM or plate fluorescence reader, respectively. Means ± SEM are shown (E) Differences in the loss of mitochondria potential were calculated at 60 min. Mean ±SD, ***p<0.001, **p<0.01, two‐way ANOVA. Data for CMs are pooled from seven experiments with two mice used per experiment (A); data for B cells are pooled from three experiments with three mice used for each experiment; from two experiments with three mice per experiment (B); from three experiments with two to three mice per experiment (D‐E).
