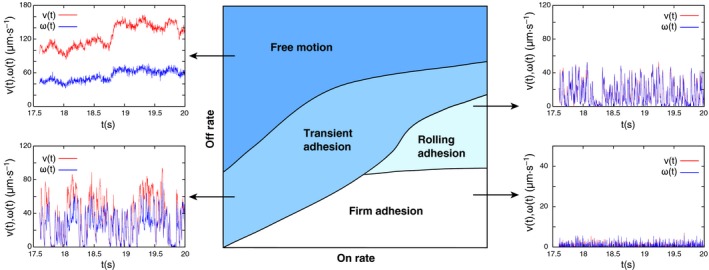
Figure 4.

Phase diagram of adhesive dynamics with representative trajectories. Computer simulations can be used to predict how adhesive cells, such as leukocytes or infected red blood cells, move in hydrodynamic shear flow above a wall 69, 70. As a function of molecular association rate (x‐axis) and dissociation rate (y‐axis), one typically finds the four different regimes as shown here. Free motion is characterized by smooth changes in translational and angular velocities. At lower dissociation rates, transient adhesion occurs, with repeated binding and unbinding leading to strongly variable trajectories. Rolling is characterized by synchronization of translation and rotation and occurs for a high association rate and an intermediate dissociation rate, for example, as is seen for selectin‐mediated adhesion of leukocytes. Firm adhesion with low translational and rotational velocities occurs for low dissociation rates, which corresponds to adhesion through activated integrins.
