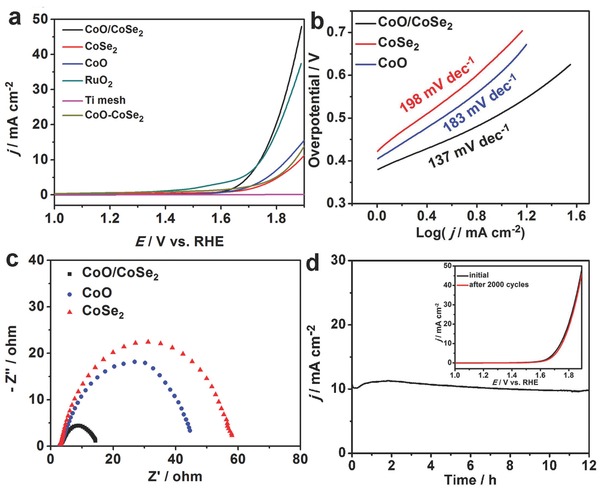
Figure 4.

a) LSV curves of bare Ti mesh, pure CoO, pure CoSe2, RuO2, CoO‐CoSe2 (physical mixture), and CoO/CoSe2 (scan rate: 10 mV s−1) for OER in 0.5 m phosphate buffer solution (pH = 6.86). b) Tafel plots for pure CoSe2, pure CoO, and CoO/CoSe2. c) EIS of pure CoSe2, CoO/CoSe2 for OER at 1.75 V. d) I–t curve of CoO/CoSe2. Inset is LSV curves of CoO/CoSe2 before and after 2000 potential cycles.
