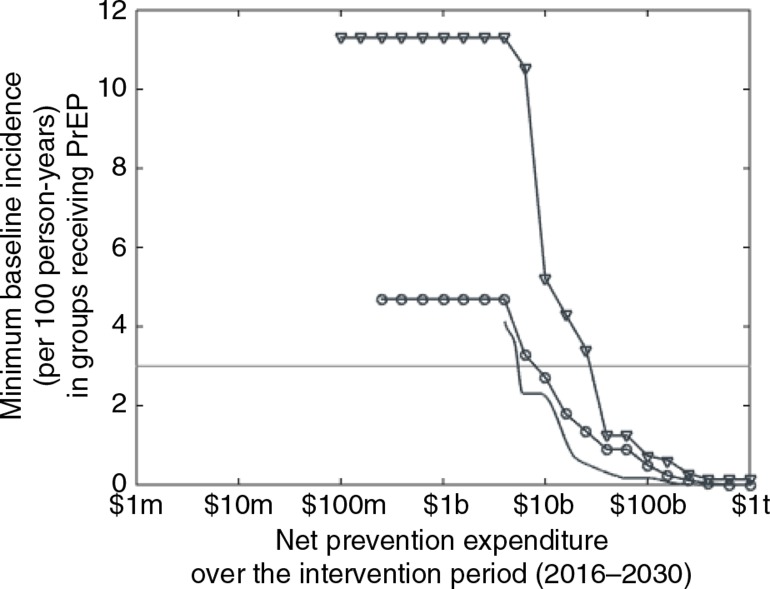
Figure 3.
PrEP implementation by incidence.
Minimum baseline incidence, or minimum incidence per 100 person-years occurring in 2015 in the absence of PrEP, in the subnational regions where PrEP is funded for female sex workers (circles), men who have sex with men (triangles), and the lower-risk general population (plain curve), as a function of net prevention expenditure over the 15-year intervention period. The horizontal line marks an incidence of 3 per 100 person-years. The x-axis is on a log scale (m=million, b=billion, t=trillion).

