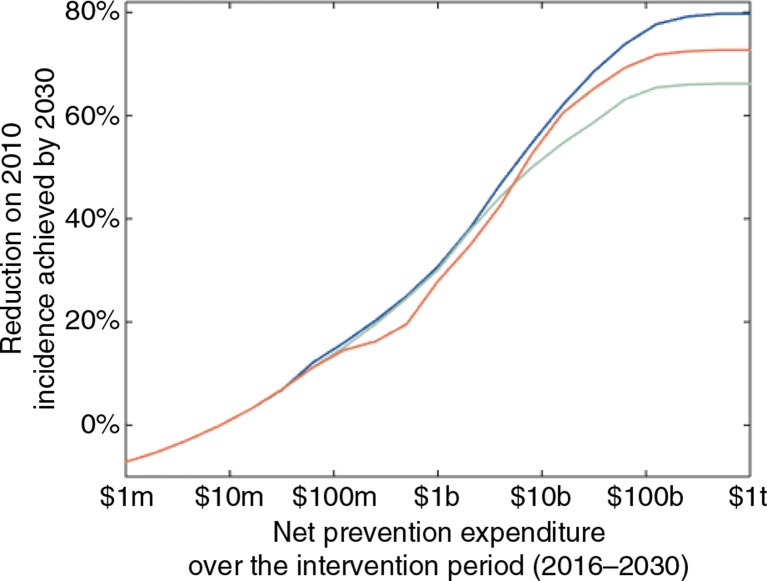
Figure 4.
Impact of optimal prevention under different strategies for PrEP.
Percent reduction on the total HIV incidence in 2010 that can be achieved by 2030, as a function of net prevention expenditure, for optimal prevention allocation with PrEP (blue), without PrEP (green) and with a benchmark incidence of 3 per 100 person-years for PrEP implementation (red). Other prevention modalities in the optimisation are behaviour change communication, early ART, and voluntary medical male circumcision. For very low prevention expenditures (<$10 million), there is so little capacity for scale-up that the epidemic rebounds slightly from its 2010 levels due to population growth. The marginal gain from including PrEP in the optimisation increases with prevention expenditure, with a maximum total reduction on 2010 incidence levels of 80%, given our assumptions around the effectiveness and coverage achievable with the interventions. The x-axis is on a log scale (m=million, b=billion, t=trillion).

