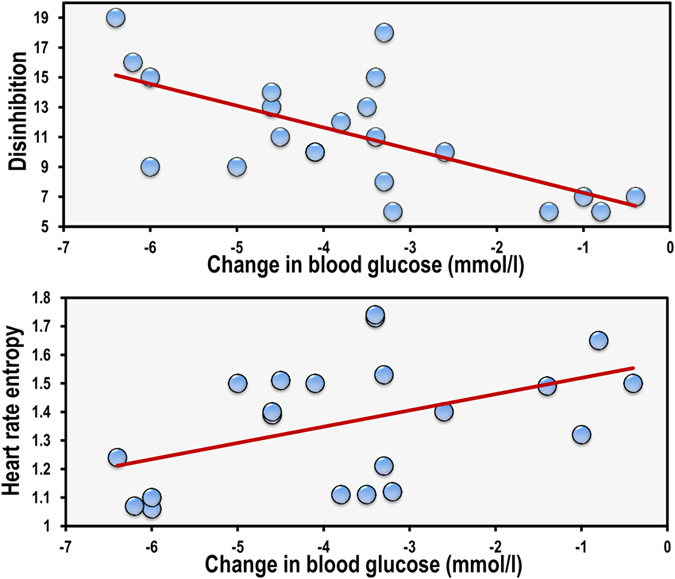
Figure 6. The associations between disinhibited eating change in blood glucose and heart rate complexity.

Data are resting heart rate entropy, disinhibition scores from the three factor eating questionnaire and change in blood glucose (after one hundred and fifty minutes minus after thirty minutes) (N = 21). Disinhibited eaters had a lower heart rate complexity (B = −5.80, 95% CI −9.80, −1.81) which in turn was related to a sharper decline in blood glucose levels (B = 6.228, 95% CI 2.431, 10.025).
