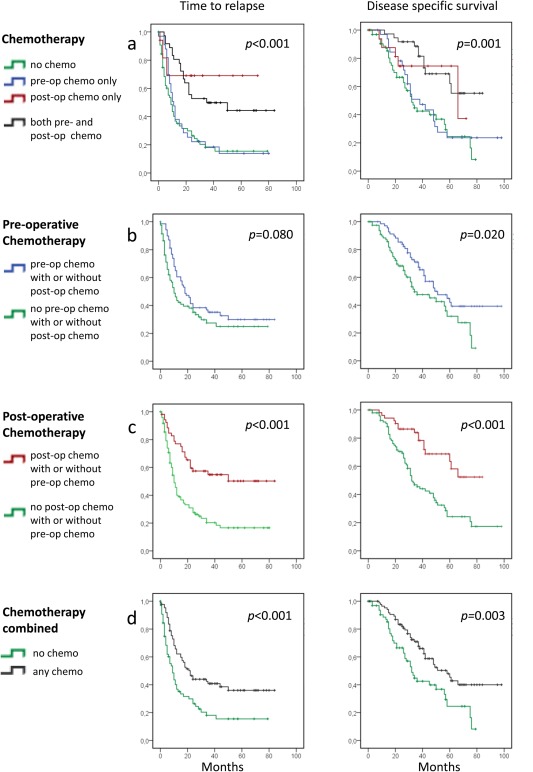
Figure 3.

Kaplan–Meier survival curves illustrating differences in time to relapse (left panels) and disease‐specific survival (right panels) after liver surgery for metastatic colorectal cancer, based on chemotherapy regimens administered at different times in relation to liver surgery. p‐values are from log‐rank tests. (a) All four treatment groups presented. (b) All patients receiving preoperative chemotherapy (alone or combined with postoperative chemotherapy) vs. patients receiving no preoperative chemotherapy (with or without postoperative chemotherapy). (c) Patients receiving postoperative chemotherapy (alone or in concert with preoperative therapy) vs. patients receiving no postoperative chemotherapy (with or without preoperative chemotherapy). (d) All patients receiving chemotherapy for liver metastases at any time vs. patients who did not receive any chemotherapy. n = 151 in each panel.
