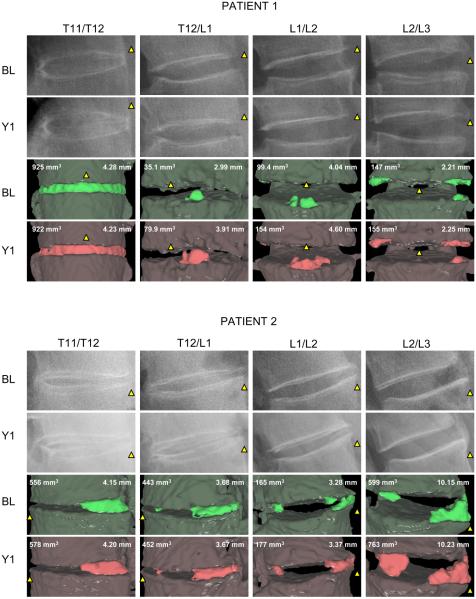
Figure 4.
Syndesmophyte evolution over 1 year in two patients. The columns show the four intervertebral disc spaces. Lateral radiographs at baseline (BL) and year 1 (Y1) are shown in the first two rows. The following rows show the three-dimensional surface views of the syndesmophytes (bright green and red) segmented from the CT scans at baseline and year 1 The computed syndesmophyte volume (mm3) and maximal height (mm) are indicated. To aid orientation, the yellow triangles indicate the anterior aspect of the intervertebral disc space.

