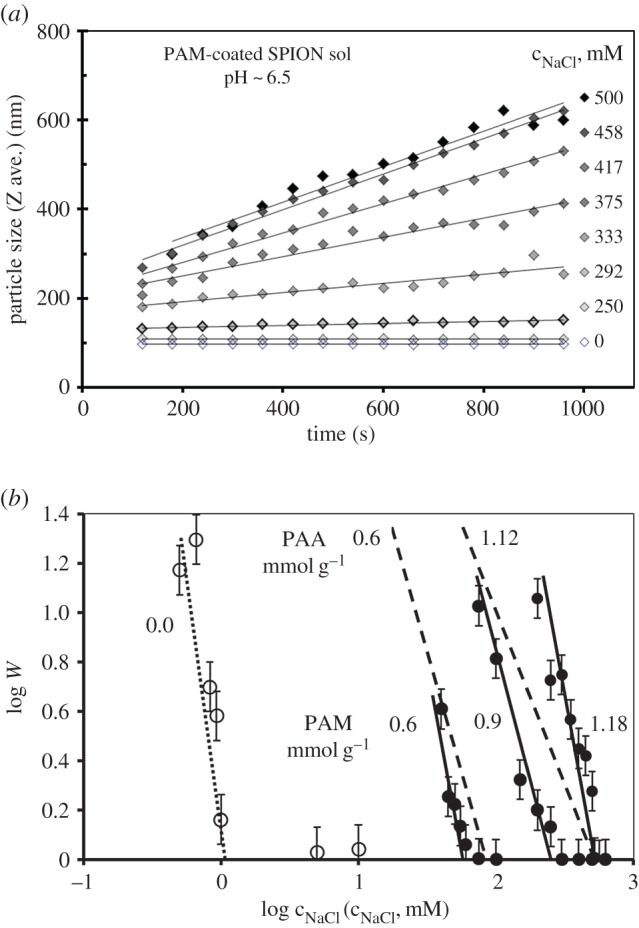
Figure 4.

Coagulation kinetics measured by DLS: the size evolution of aggregates in PAM-coated SPION sols at pH ∼6.5 and different NaCl concentrations, at 25 ± 0.1°C (a). Stability plots to determine the values of the critical coagulation concentration of naked (open symbols) and PAA (0.6, 1.12 mmol g−1 dashed lines) and PAM (0.6, 0.9 and 1.18 mmol g−1 solid lines) coated (filled symbols) SPIONs dispersed in aqueous media at pH ∼ 6.5 (b). Reproduced with permission from [22]. Copyright © 2012 American Chemical Society.
