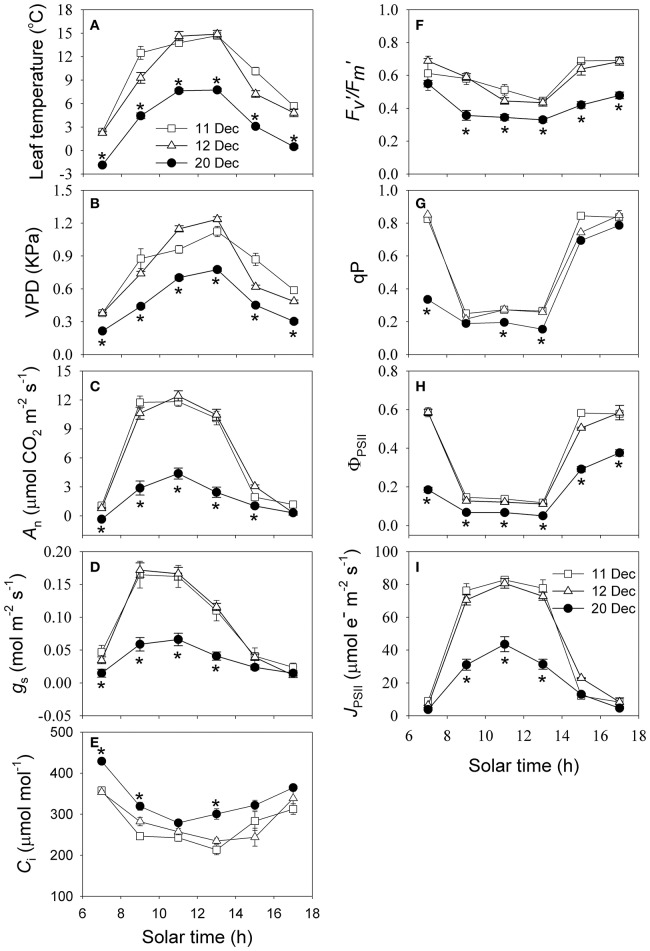
Figure 3.
Diurnal measurements of (A) leaf temperature, (B) vapor pressure deficit (VPD), (C) net CO2 assimilation rate (An), (D) stomatal conductance (gs), (E) intercellular CO2 concentration (Ci), (F) maximum quantum yield of photosystem II after light adaptation (Fv′/Fm′), (G) coefficient of photochemical quenching (qP), (H) effective quantum yield of photosystem II (ΦPSII), (I) electron flow through PSII calculated using data of chlorophyll fluorescence (JPSII) on 11, 12, and 20 December 2013. Values are means ± SE (n = 5). Asterisks indicate significant differences on 20 December when compared to 11 and 12 December.

