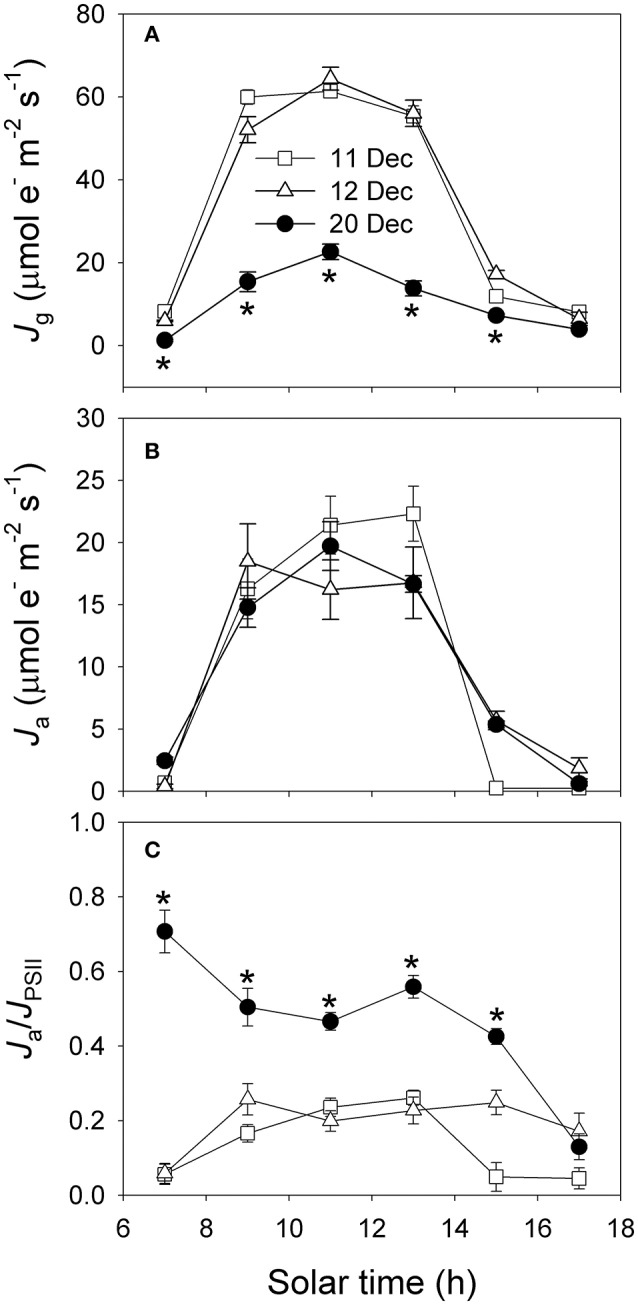
Figure 8.

Diurnal changes in Jg (A), Ja (B), and Ja/JPSII (C) on 11, 12, and 20 December 2013. Jg, electron flow devoted to production of NADPH calculated using data of gas exchange. Ja, alternative electron flow calculated from the difference between JPSII and Jg. Values are means ± SE (n = 5). Asterisks indicate significant differences on 20 December when compared to 11 and 12 December.
