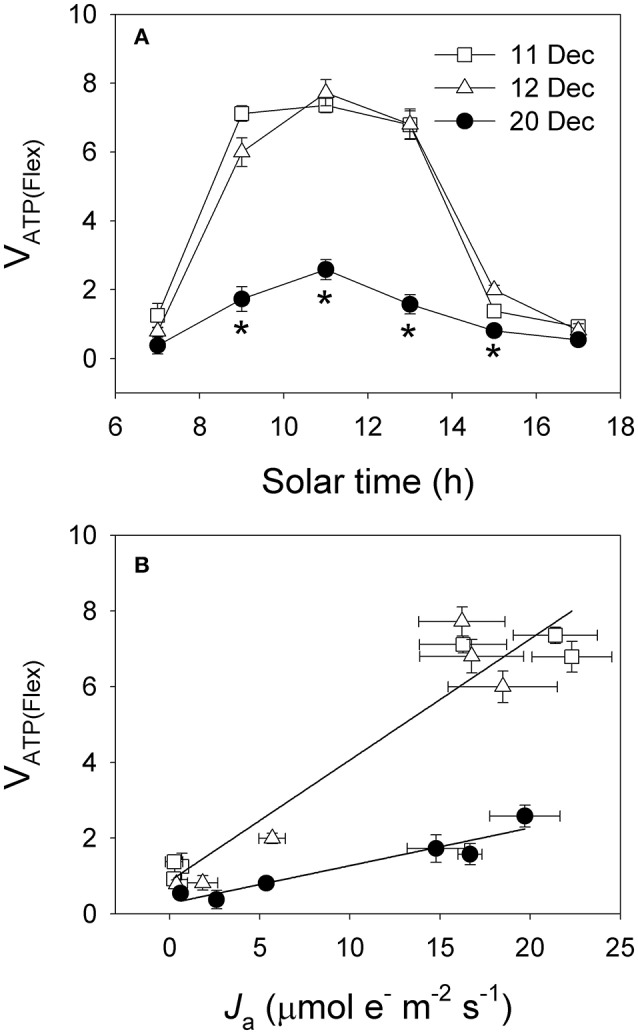
Figure 9.

(A) Diurnal changes in the rates of ATP supplied from other flexible pathways (vATP(Flex)). (B) Relationship between the WWC activity (Ja) and vATP(Flex). Values are means ± SE (n = 5). Asterisks indicate significant differences on 20 December when compared to 11 and 12 December.
