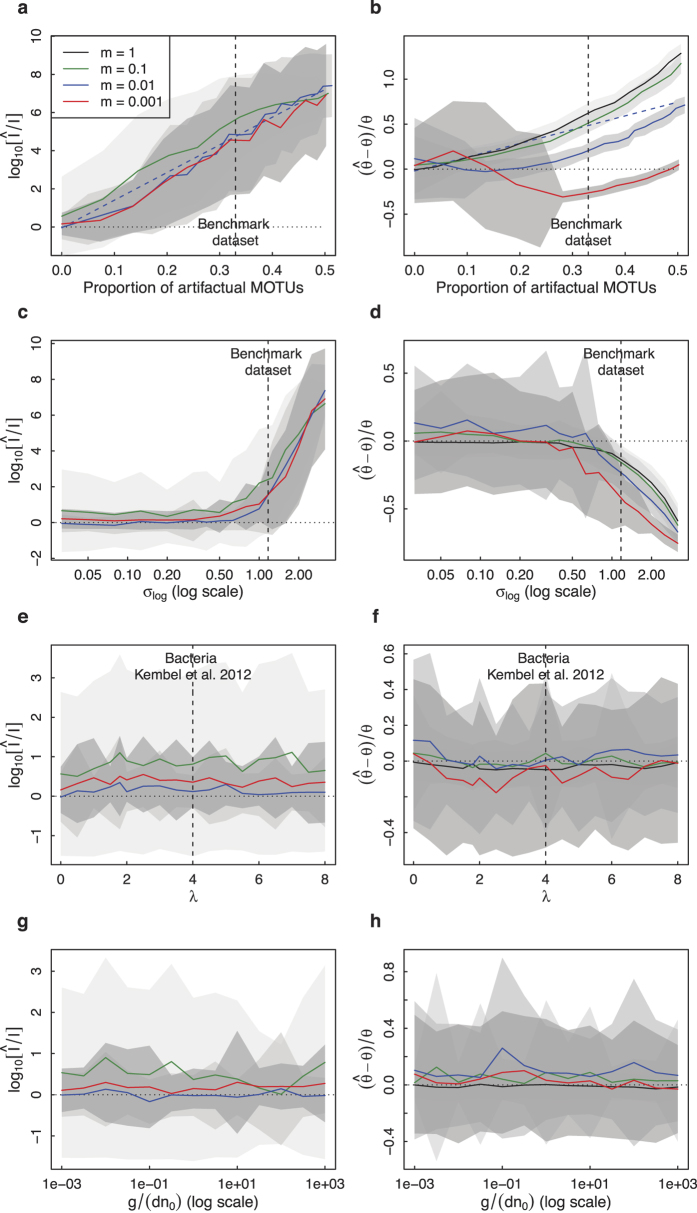
Figure 2. Neutral parameter inference in the presence of dispersal limitation.
We simulated a 104-read sample and computed the mean and standard deviation over 100 realizations of  and
and  . Results are plotted for θ = 20 and for m = 1 (black), m = 0.1 (green), m = 0.01 (blue) and m = 0.001 (red). Panels a,b: variation with the proportion of artifactual MOTUs (dashed blue line underlines the linear dependence). Panels c,d: variation with the log standard deviation σlog of a multiplicative lognormal noise on relative abundances. Panels e,f: variation with the parameter λ of a multiplicative zero-truncated Poisson noise. Panels g,h: variation with body size ratio
  .
.

