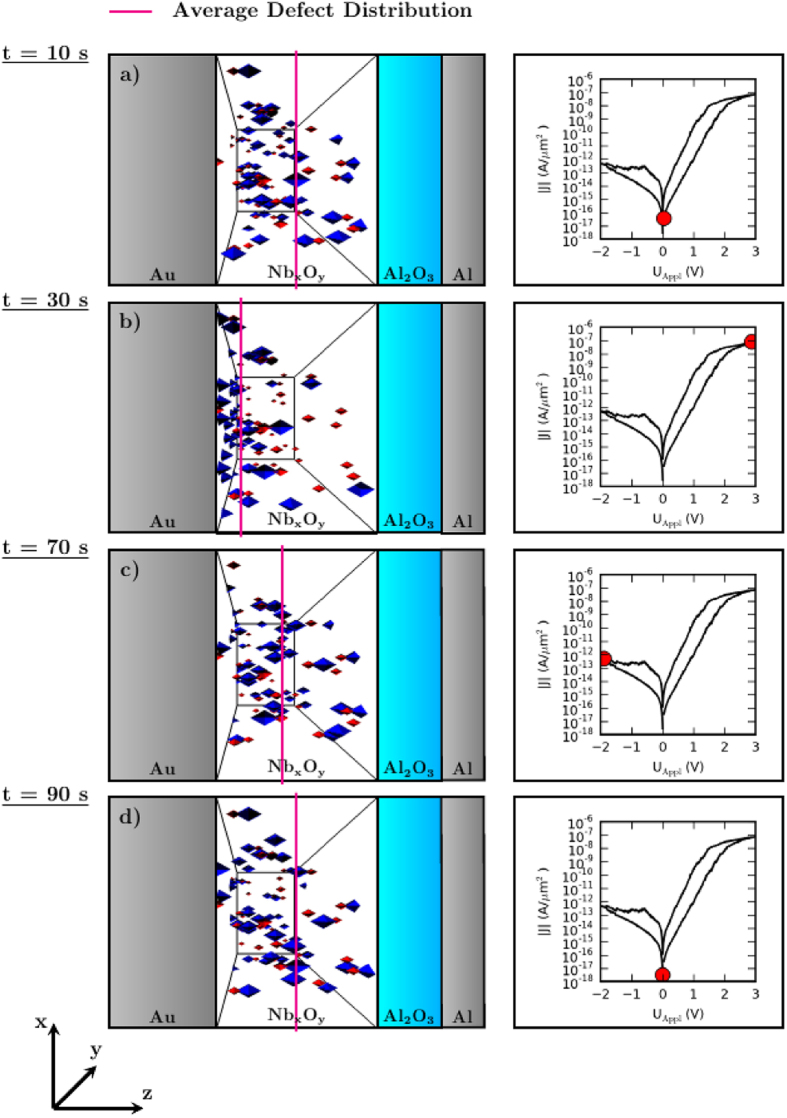
Figure 3.
The positions of the immobile positively (red) and mobile negatively (blue) charged point defects as an outcome of the simulation are given on the left hand side for four different instants of time. The corresponding position on the current-voltage characteristics is indicated by a red dot on the right hand side. The colored line represents the average position of the negatively charged point defects at the presented time step.

