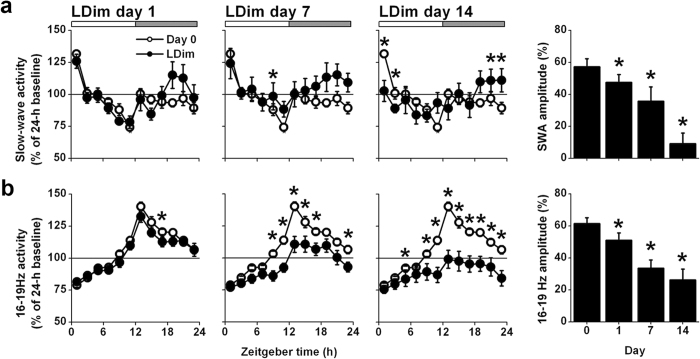
Figure 2. LDim reduces the daily rhythm of slow wave activity and 16–19 Hz activity within NREM sleep.
(a) LDim (closed circles) decreased the amplitude of the daily rhythm in slow wave activity (SWA) compared to the baseline measurement (open circles). (b) LDim also strongly decreased the amplitude of 16–19 Hz activity compared to baseline. Data are expressed as percentage of the 24-h average at baseline. Registrations on day 0 and day 1 started at ZT12, but all data are plotted from ZT0 for convenience. Data are represented as mean ± SEM. If a significant main effect was detected, post hoc tests for differences from baseline were performed with student’s t-test and indicated by asterisks (P < 0.05) or double asterisks (P < 0.001).

