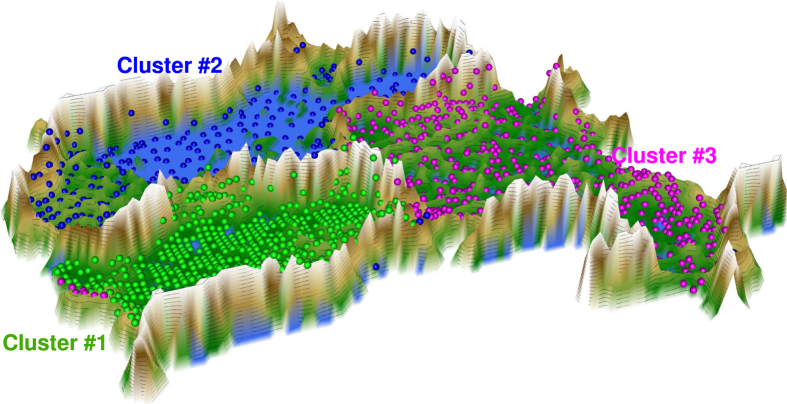
Figure 1. 3D-display of the U-matrix representation of the olfactory subtest results pattern obtained using a projection of the data points onto a grid 4,000 neurons where opposite edges are connected (toroid grid).
The U-Matrix was colored as a geographical map with brown or snow-covered heights and green valleys. The cluster structure emerges from visualization of the distances between neurons in the high-dimensional space by means of a U-Matrix. Thus, on the 3D-display the valleys indicate subjects sharing similar subtest patterns while the mountain ranges with “snow-covered” heights separate the clusters (for a top view, see Fig. 3 left). The dots indicate the so-called “best matching units” (BMUs) of the self-organizing map (SOM), which are those neurons whose weight vector after SOM training was most similar to the input vector carried by particular subjects. The BMU coloring corresponds to the cluster membership. The figure displaying a geographical map analogy has been created using our R library “Umatrix” (M. Thrun, F. Lerch, Marburg, Germany, http://www.uni-marburg.de/fb12/datenbionik/software ; file http://www.uni-marburg.de/fb12/datenbionik/umatrix.tar.gz).

