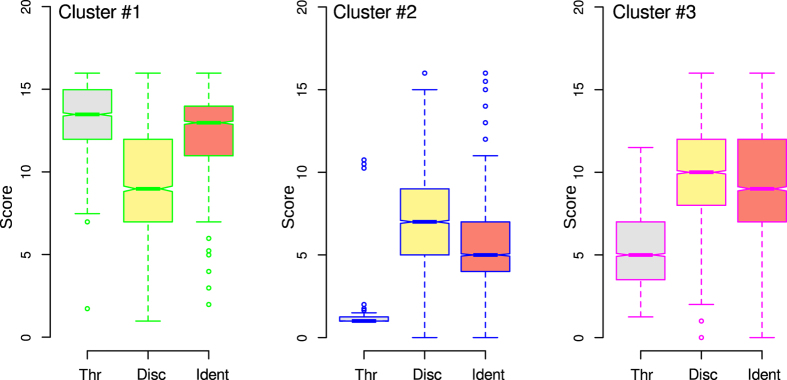
Figure 2. Cluster–specific (Fig. 1) olfactory subtest results (Thr = olfactory threshold, Disc = odor discrimination, Ident = odor identification).
The box borders and lines colors are set at the coloring of the clusters in Fig. 1. The minimum, quartiles, median (solid horizontal line within the box), and maximum are used to construct a “box and whisker plot. The notches display a confidence interval around the median. The figure has been created using the R software package (version 3.2.3 for Linux; http://CRAN.R-project.org/22).

