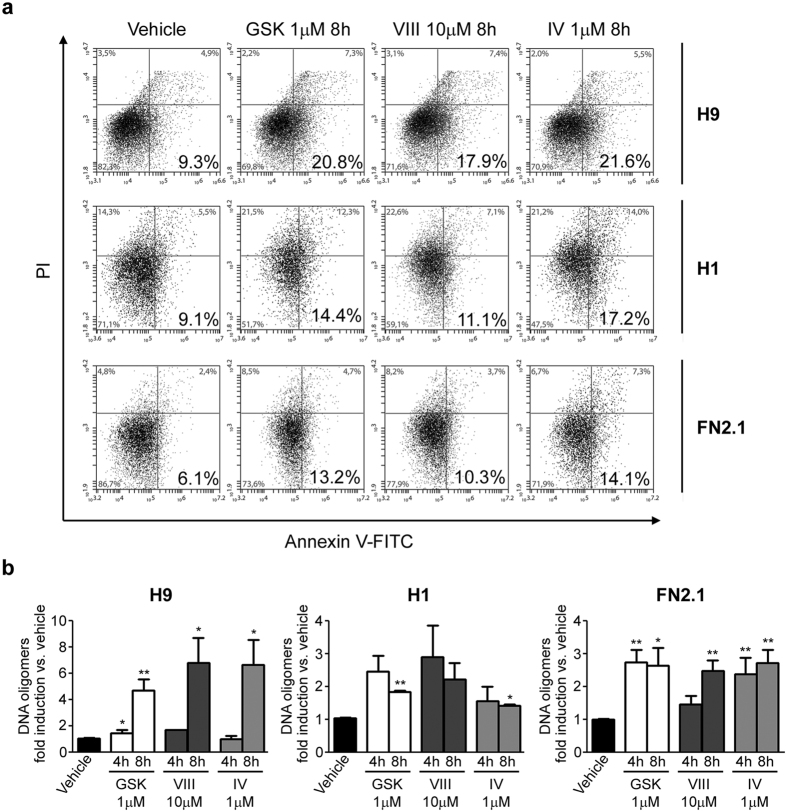
Figure 3. Annexin V translocation and DNA fragmentation upon AKT inhibition.
(a) Phosphatidylserine (PS) translocation from the inner to the outer leaflet of the plasma membrane was examined by Annexin V and propidium iodide (PI) double staining. A representative of three independent experiments biparametric flow cytometry analysis of combined fluorescein isothiocyanate (FITC)-conjugated Annexin V and PI staining distinguishing viable (PI−, Annexin V− bottom left), early apoptotic (PI−, Annexin V+ bottom right), late apoptotic (PI+, Annexin V+; top right) and necrotic (PI+, Annexin V−, top left) cells is shown for H9, H1 and FN2.1 after 8 hours of incubation with AKT inhibitors [AKTi IV (IV, 1 μM), AKTi VIII (VIII, 10 μM) and GSKi (GSK, 1 μM)]. Percentage of cells in each quadrant is shown. (b) Genomic DNA fragmentation into oligomers of 180–200 bp or multiples of that was quantified in H9, H1 and FN2.1 cells at 4 and 8 hours post-treatment with AKT inhibitors [AKTi IV (IV, 1 μM), AKTi VIII (VIII, 10 μM) and GSKi (GSK, 1 μM)] using a specific ELISA kit. Mean + SEM fold induction relative to Vehicle (DMSO) of three independent experiments are shown. Statistical analysis was done by Student’s t-test, *p = <0.05 and **p = <0.01 vs. Vehicle (DMSO).

