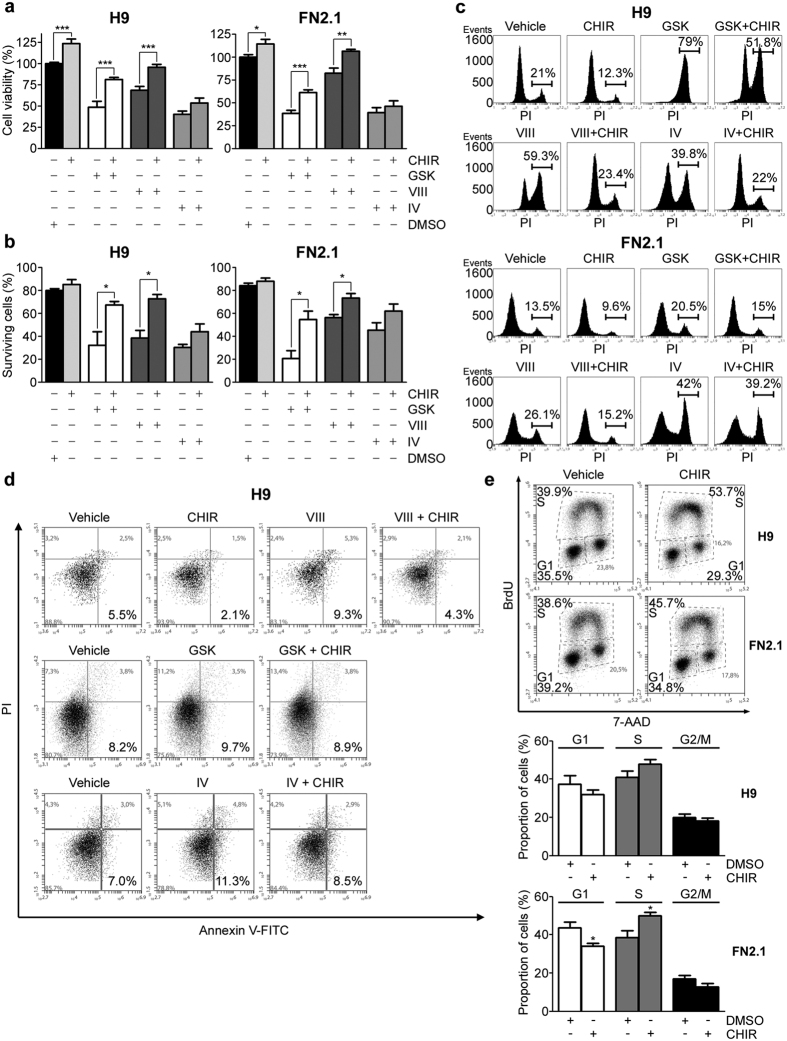
Figure 6. Involvement of GSK3β signaling in AKT regulation of hESCs and hiPSCs cell viability and apoptosis.
(a) H9 and FN2.1 cell viability was analyzed by XTT colorimetric assay at 24 hours post-treatment with AKT inhibitors IV (IV, 1 μM), VIII (VIII, 10 μM) and GSKi (GSK, 1 μM) in the presence or absence of CHIRi (CHIR, 3 μM). Mean + SEM from three independent experiments are shown. Statistical analysis was performed by Student’s t test, *p = <0.05; **p = <0.01 and ***p = <0.001 (b) Histogram shows quantitative percentage of surviving cells assessed by Trypan blue exclusion method 24 hours post-AKT inhibitors treatment [IV (1 μM), VIII (10 μM) and GSK (1 μM)] with or without CHIRi (CHIR, 3 μM). Mean + SEM from three independent experiments are shown. Student’s t test, *p = <0.05. (c) Representative histograms, of three independent experiments, of Propidium iodide (PI) staiStatistical analysis was donened H9 and FN2.1 unfixed cells treated for 24 hours with AKT inhibitors [IV (1 μM), VIII (10 μM) and GSK (1 μM)] in combination or not with CHIRi (CHIR, 3 μM). Percentage of PI positive cells (late apoptotic or necrotic) was determined by flow cytometric analysis. Vehicle: DMSO. (d) A representative biparametric flow cytometry analysis, of three independent experiments, of combined fluorescein isothiocyanate (FITC)-conjugated Annexin V and PI staining identifying viable (bottom left), early apoptotic (bottom right), late apoptotic (top right) and necrotic (top left) cells is shown for H9 cells at 8 hours post-AKT inhibitors treatment [IV (1 μM), VIII (10 μM) and GSK (1 μM)] in combination or not with CHIRi (CHIR, 3 μM). Vehicle: DMSO. Percentage of cells in each quadrant is shown. (e) Representative BrdU-APC/7-AAD flow cytometry cell cycle analysis of H9 and FN2.1 undifferentiated cells treated with CHIRi (CHIR, 3 μM) for 24 hours. Vehicle: DMSO. Means + SEM from three independent experiments are graphed for the proportion of cells (%) in each stage of cell cycle (G1, S and G2/M). Statistical analysis was performed by Student’s t-test, *p = <0.05 vs. Vehicle (DMSO).

