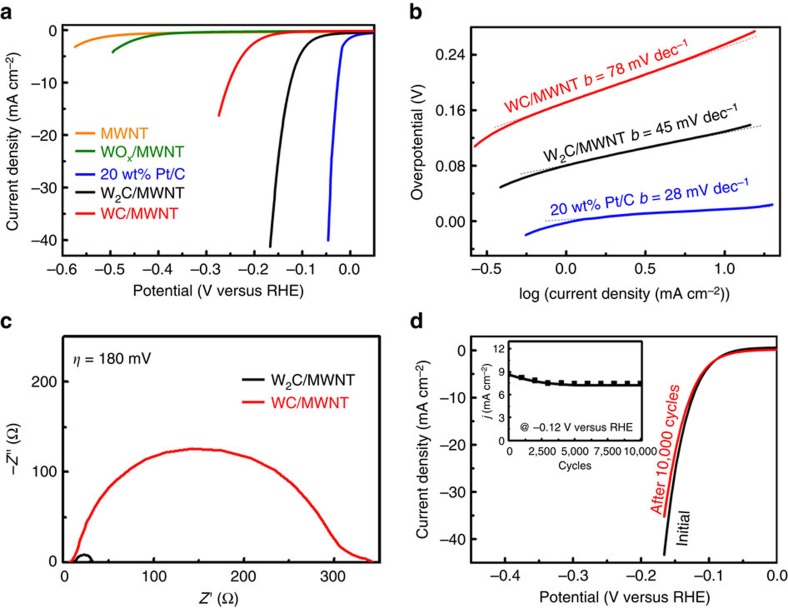
Figure 4. Electrochemical measurements of W2C/MWNT for HER in 0.5 M H2SO4.
(a) Polarization curve of W2C/MWNT in comparison with 20 wt% Pt/C, WC/MWNT, WOx/MWNT or MWNTs alone. (b) Tafel plot of W2C/MWNT in comparison with 20 wt% Pt/C and WC/MWNT. (c) Electrochemical impedance spectrum of W2C/MWNT at η=180 mV in comparison with WC/MWNT. (d) Polarization curve of W2C/MWNT before and after 10,000 potential cycles. The inset shows the change of HER cathodic current density at −0.12 V versus RHE with respect to the number of potential cycles.

