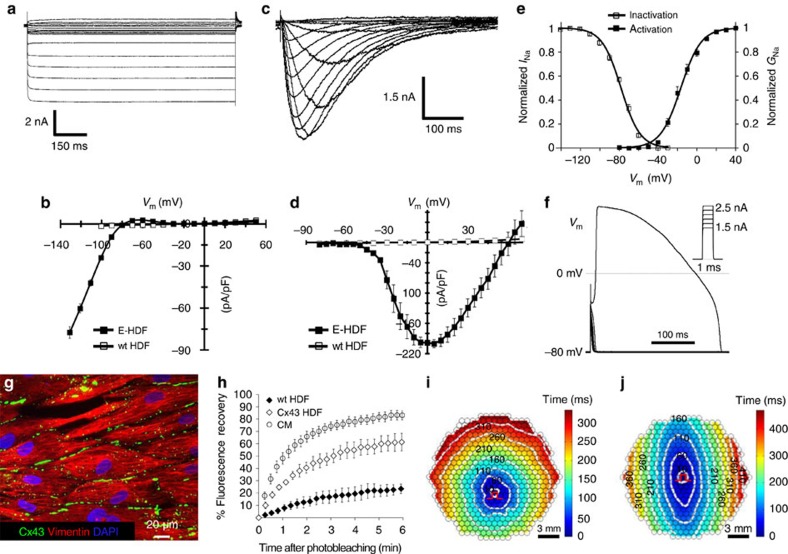
Figure 1. Generation of actively conducting human E-Fibs.
(a) Voltage-clamp recording of IK1 in E-HDFs. (b) Steady-state IK1–V curves in E-HDF and wt (unexcitable) HDF. (c–e) Recording of INa (c), peak INa–V curve (d) and voltage dependence of INa activation and steady-state inactivation (e) in E-HDFs expressing NavRosD G217A. In b,d,e: n=8–10. Data in a–e recorded at 25 °C. (f) All-or-none AP response in E-HDFs induced by current pulses (Im) of increasing amplitude. (g,h) Stable overexpression of Cx43 in E-HDFs (g) results in formation of functional gap junctions, shown by increased recovery of fluorescence after photobleaching, albeit at a slower rate than that of neonatal rat cardiomyocytes (CM) (h, n=6). (i,j) Representative isochrone maps of AP conduction in electrically stimulated isotropic (i) and anisotropic (j) monolayers of E-HDFs stably co-expressing Kir2.1, NavRosD G217A and Cx43. Pulse signs indicate position of stimulating electrode. Circles denote 504 recording sites. All electrophysiological data obtained at 37 °C, unless otherwise specified. Error bars indicate s.e.m.

