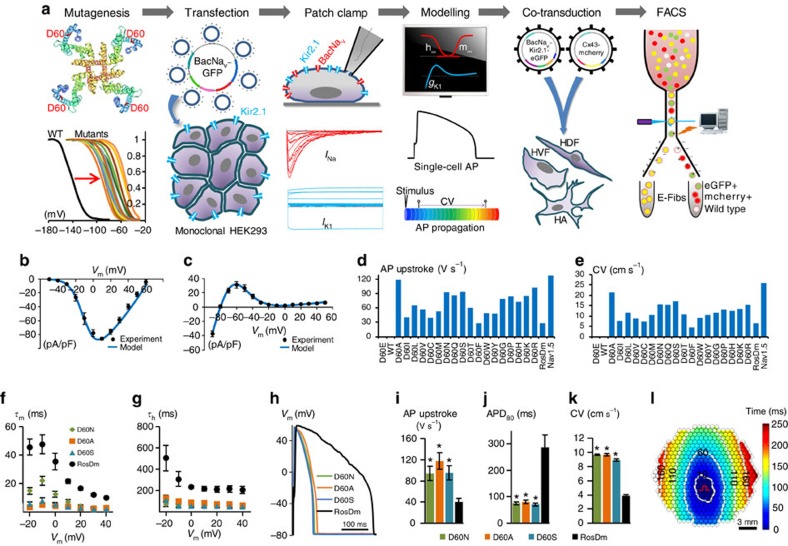
Figure 2. Customization of E-Fib phenotype via mutagenesis.
(a) BacNav-based strategy for E-Fib customization. (b) Experimental (n=8) and modelling peak INa–V curves. Cell membrane was held at −80 mV before stepping the voltage from −50 to 60 mV in 10 mV increments. (c) Experimental (n=21) and modelling steady-state IK–V curves. Cell membrane was held at −40 mV before stepping the voltage from −90 to 50 mV in 10 mV increments. (d,e) AP initiation and conduction characteristics of BacNav mutant expressing E-HDFs obtained by computational modeling: upstroke velocity (d) and CV (e). For modelling, parameters derived from voltage-clamp measurements at 25 °C were scaled for the temperature of 37 °C. Highly hyperpolarized inactivation of WT and D60E channels prevented AP initiation. (f,g) Time constants of activation (f) and inactivation (g) of selected NavSheP D60X mutants compared with NavRosD G217A (RosDm), recorded in E-HEK293 cells at 25 °C (n=5). (h–j) When co-expressed with Kir2.1 in E-HEK293 cells, NavSheP mutants give rise to APs (h) with faster upstroke (i; n=10–18) and shorter duration (j; n=10–18) than NavRosD G217A (n=11 for i,j). (k) NavSheP D60X expressions in anisotropic E-HDF monolayers yield faster CV than RosDm expression (n=5–10). (l) Representative isochrone map of AP conduction in an electrically stimulated anisotropic monolayer of E-HDFs stably co-expressing Kir2.1, NavSheP D60N and Cx43 (compare also with Fig. 1j). *P<0.001 versus RosDm (i–k). All electrophysiological data obtained at 37 °C, unless otherwise specified. Error bars indicate s.e.m; statistical significance was determined by one-way analysis of variance, followed by Tukey's post-hoc test to calculate P-values.

