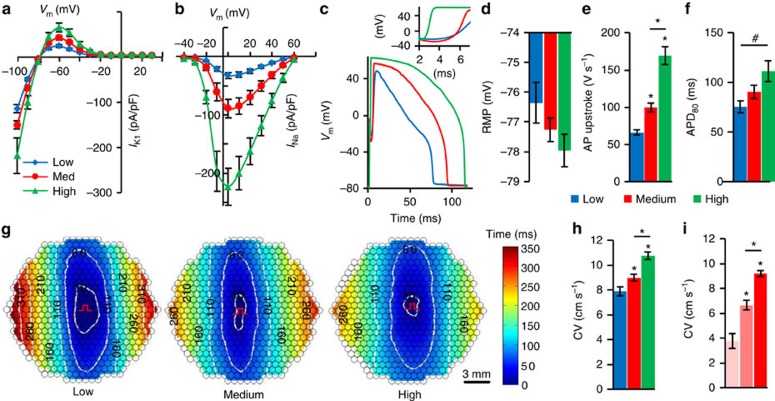
Figure 3. Tuning electrical properties of E-Fibs via FACS.
(a,b) Steady-state IK1–V curves (a; n=8–12) and peak INa–V curve (b; n=8–12) in three groups (blue, red and green denoting low, medium and high eGFP-expressing cells, respectively), measured at 25 °C. (c) Representative AP traces with inset showing AP upstrokes in the three eGFP-sorted E-HDF groups. (d–f) Resting membrane potential (RMP, d), maximum AP upstroke velocity (e) and APD80 (f) in the three eGFP-sorted E-HDF groups (n=14–18). (g,h) Representative isochrone maps of AP conduction in electrically stimulated anisotropic monolayers of E-HDFs (g) showing that cells with higher eGFP expression had faster CV (h; n=6–10). All E-HDFs were first sorted for high Cx43-mCherry level to ensure strong intercellular coupling. Pulse signs indicate location of stimulating electrode. Circles denote 504 recording sites. (i) CV in electrically stimulated monolayers of three mCherry-sorted E-HDF groups (left, middle and right bars denoting low, medium and high mCherry-expressing cells, respectively; n=5). #P<0.01 in f; *P<0.001 versus low eGFP group in e,h or versus low or medium mCherry group in i. All electrophysiological data obtained at 37 °C, unless otherwise specified. Error bars indicate s.e.m; statistical significance was determined by one-way analysis of variance, followed by Tukey's post-hoc test to calculate P-values.

