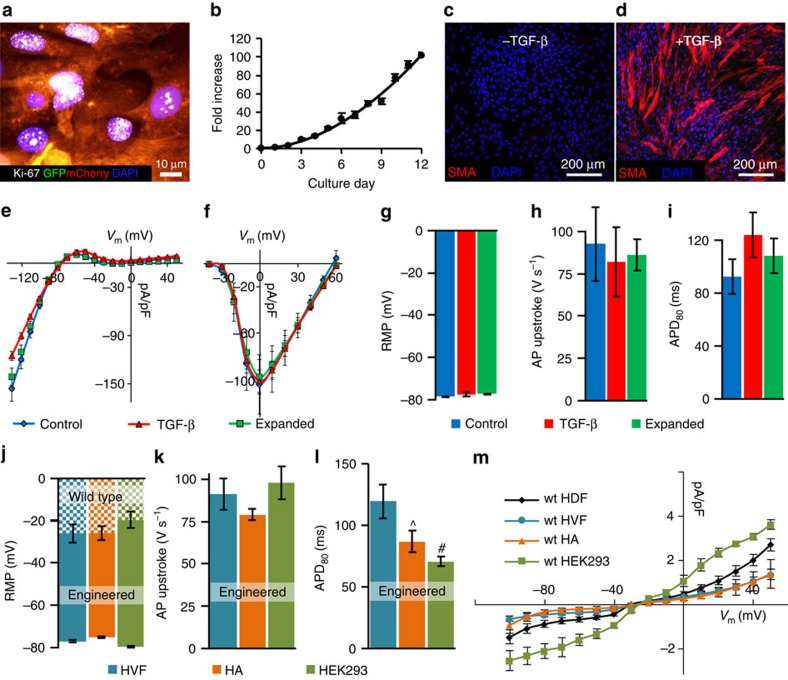
Figure 4. Stability and robustness of E-Fib phenotype.
(a,b) E-HDFs transduced with NavSheP D60N-P2A-eGFP-Kir2.1 and Cx43-P2A-mCherry lentiviruses retain proliferative potential as shown by Ki-67-positive staining (a) after ∼100-fold expansion (b), 4 weeks post-lentiviral transduction. Growth curve is fit to a power function. (c,d) Conversion of smooth muscle actin (SMA)− E-HDFs (c) to SMA+ myofibroblasts after transforming growth factor (TGF)-β treatment (d). (e–i) Steady-state IK1–V (e) and peak INa–V (f) curves (recorded at 25 °C) as well as resting membrane potential (RMP, g), APD80 (h) and AP upstroke velocity (i) do not differ among control, expanded or TGF-β-treated E-HDFs. (n=5–9). (j–l) RMP (j), maximum AP upstroke velocity (k) and APD80 (l) in different E-Fibs (E-HVF, human ventricular fibroblasts; E-HA, human astrocytes) transduced with the NavSheP D60N-P2A-eGFP-Kir2.1 lentivirus (n=6–8). (m) Steady-state I–V curves in different wt Fibs (n=4–6). ^P<0.05, #P<0.01 versus HVF in l. All electrophysiological data obtained at 37 °C, unless otherwise specified. Error bars indicate s.e.m; statistical significance was determined by one-way analysis of variance, followed by Tukey's post-hoc test to calculate P-values.

