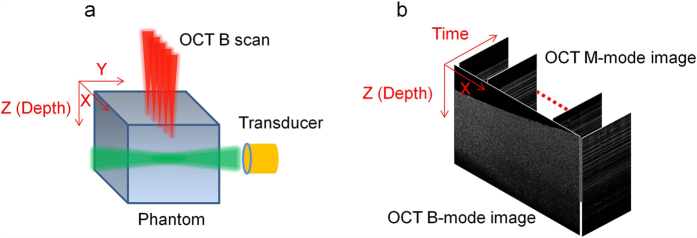
Figure 1. Data processing for 3D shear modulus mapping.
(a) Schematic of the ARF excitation and OCT detection. The acoustic force is parallel to the Y axis, OCT beam is parallel to the Z axis, and the OCT B-scan is performed along the X axis. (b) OCT M-mode images and the constructed B-mode image during the measurement.

